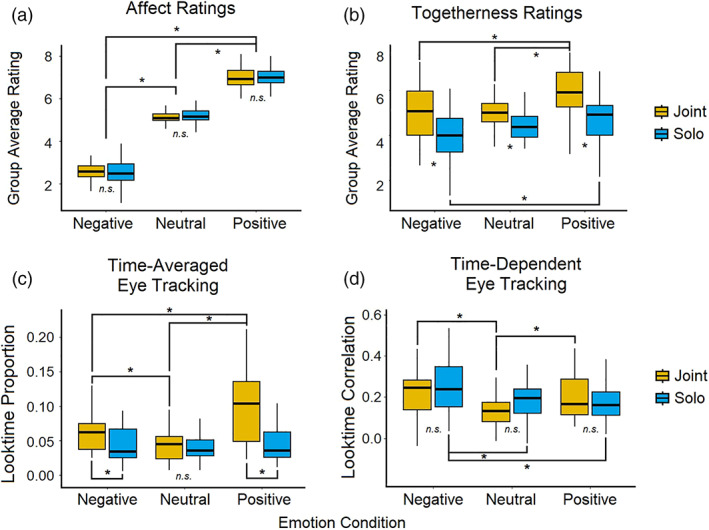
FIGURE 1.

Behavioral results. (a) Group average (N = 52) in‐scanner ratings of how emotional participants felt after watching each video on a scale of 0 (very negative) to 9 (very positive). (b) Group average (N = 38) in‐scanner ratings of how alone or together they felt with their partner after watching each video on a scale of 0 (very alone) to 9 (very together). Fewer subjects are included in this data as the togetherness question was added after 14 scans had already been completed. (c) Group average (N = 27) of the proportion of time spent looking at the partner video feed compared to the main video feed. (d) Group average (N = 27) of the correlation between individual and group (N – subject) time spent looking at the confederate through the duration of each condition
