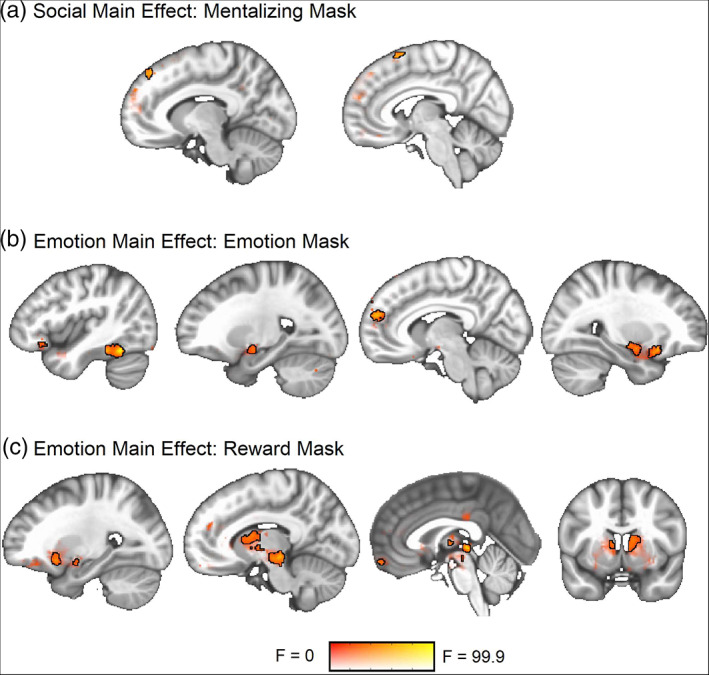
FIGURE 2.

ANOVA main effect result maps from the time‐averaged (GLM) data. Significant clusters are outlined in black at a voxel threshold of p < .001 (cluster α = 0.05). Sub‐threshold effects (i.e., F > 0, p > .001) are displayed with transparent fade and not outlined. (a) Social main effect within the mentalizing network. (b) Emotion main effect within the emotion network. (c) Emotion main effect within the reward network
