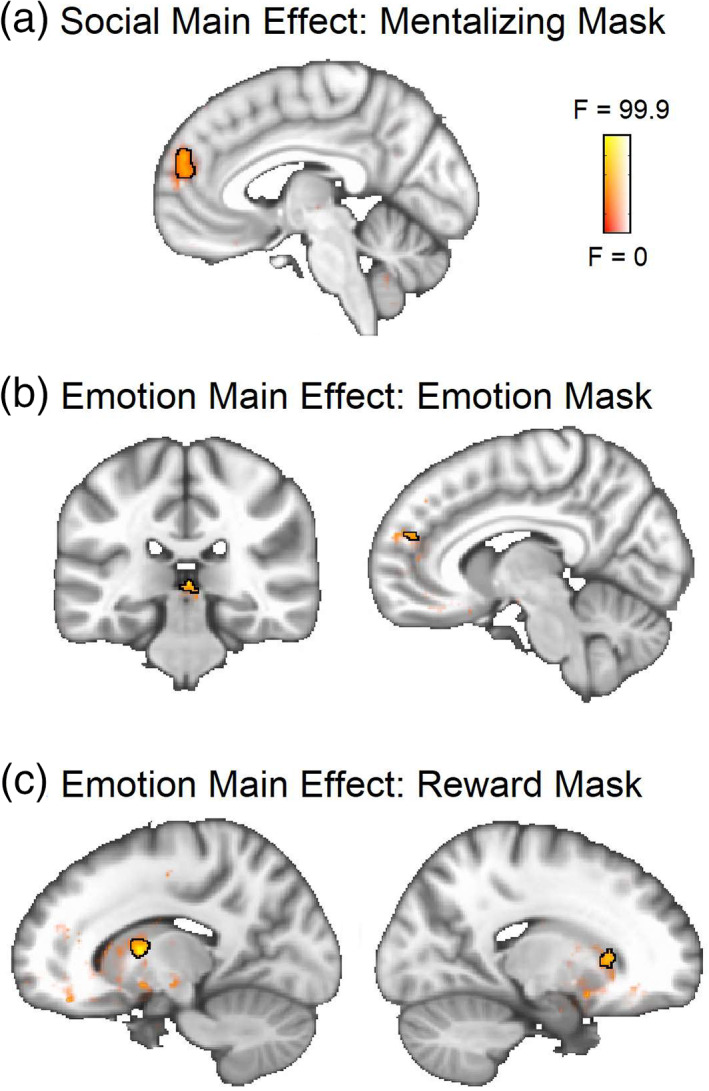
FIGURE 4.

ANOVA main effect result maps from the time‐dependent (ISC) data. Significant clusters are outlined in black at a voxel threshold of p < .001 (cluster α = 0.05). Sub‐threshold effects (i.e., F > 0, p > .001) are displayed with transparent fade and not outlined. (a) Main social effect within the mentalizing network. (b) Main 2 × 3 emotion (positive, neutral, negative) effect within the emotion network. (c) Main 2 × 3 emotion (positive, neutral, negative) effect within the reward network
