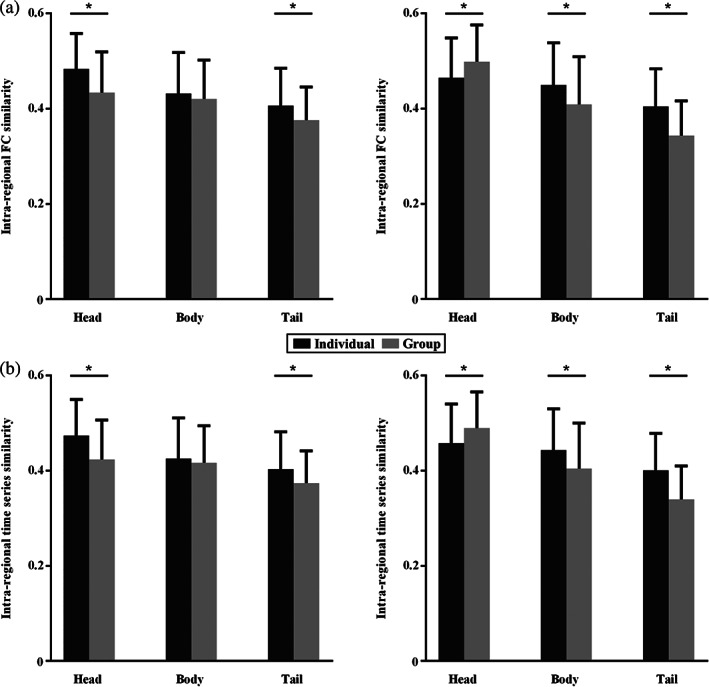
FIGURE 3.

Functional similarities comparison between the group and individual parcellation results. The intraregional functional connectivity (a) and time series (b) similarities between any pair of voxels within each hippocampus subregion were calculated. Almost all the functional connectivity and time series similarities of hippocampus subregions at the individual level are higher than that at group level except the head part of right hippocampus in which the intraregional functional connectivity and time series similarities at group level are higher than individuals. (*represents p < .05 after Bonferroni corrected)
