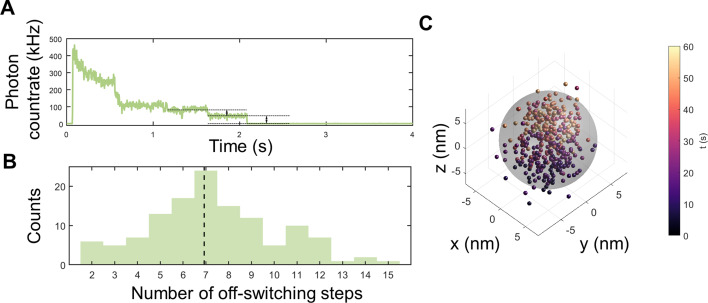
Figure 4.
MINFLUX measurements of StrepEncSM{HaloTag‐AF647}. A) Off‐switching count trace with visible off‐switching steps for a single StrepEncSM{HaloTag‐AF647} construct. B) Estimated number of fluorophores per StrepEncSM{HaloTag‐AF647} construct for all measurements (histogram, n=125) and median of the distribution (dashed line). C) 3D MINFLUX localizations of the single StrepEncSM{HaloTag‐AF647} construct. Each scatter dot represents an individual localization estimate for the position of a fluorescent AF647 molecule. The color‐coding describes when the localization was registered after starting the acquisition. Individual fluorescent molecules can deliver tens of localizations. We centered the localization with the origin by subtracting the mean position from all localizations. A sphere of 14 nm diameter (gray) encloses 94 % of localizations.

