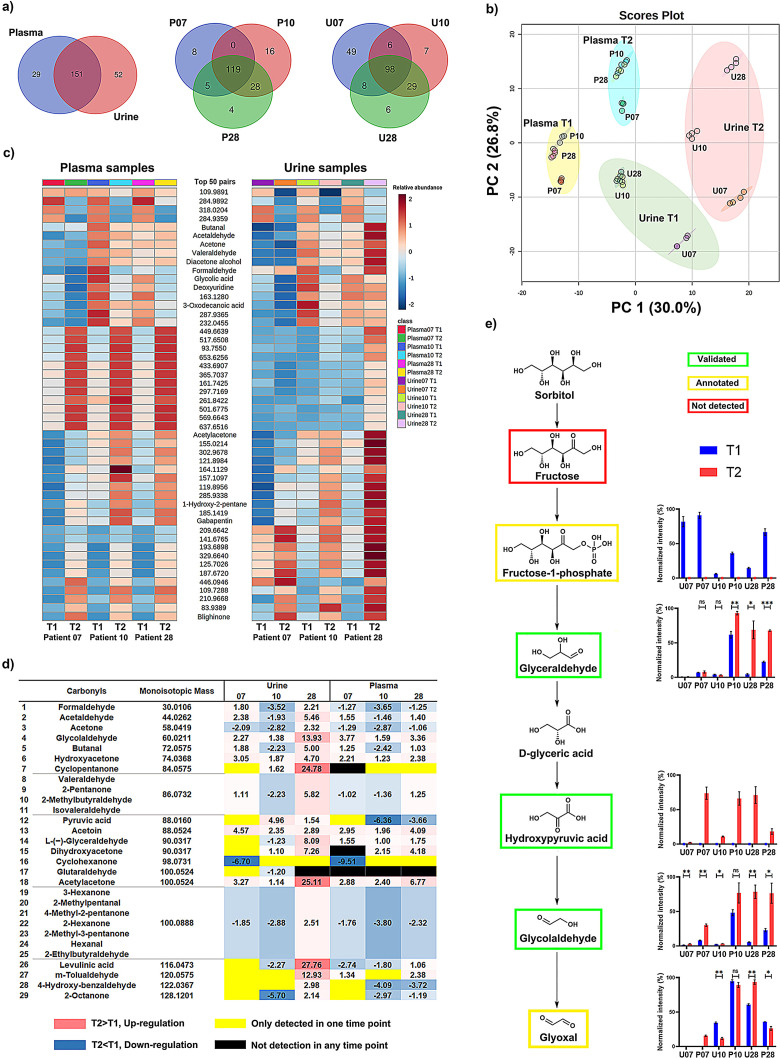
Figure 4.
Large‐scale analysis in human patient samples. a) Venn diagrams of the peak pair numbers detected in the plasma (N=6) and urine samples (N=6). b) Principal component analysis (PCA) of plasma and urine samples for three individuals at different time points. c) Heatmap of the top 50 common carbonyl‐pairs in the plasma and urine analysis (p‐value, ANOVA). d) Time‐dependent fold‐change of validated carbonyl‐metabolites in plasma and urine samples. The complete data output from this experiment is shown as a heatmap in Figure S6. e) Investigated metabolites in the sorbitol metabolism pathway in plasma and urine samples.

