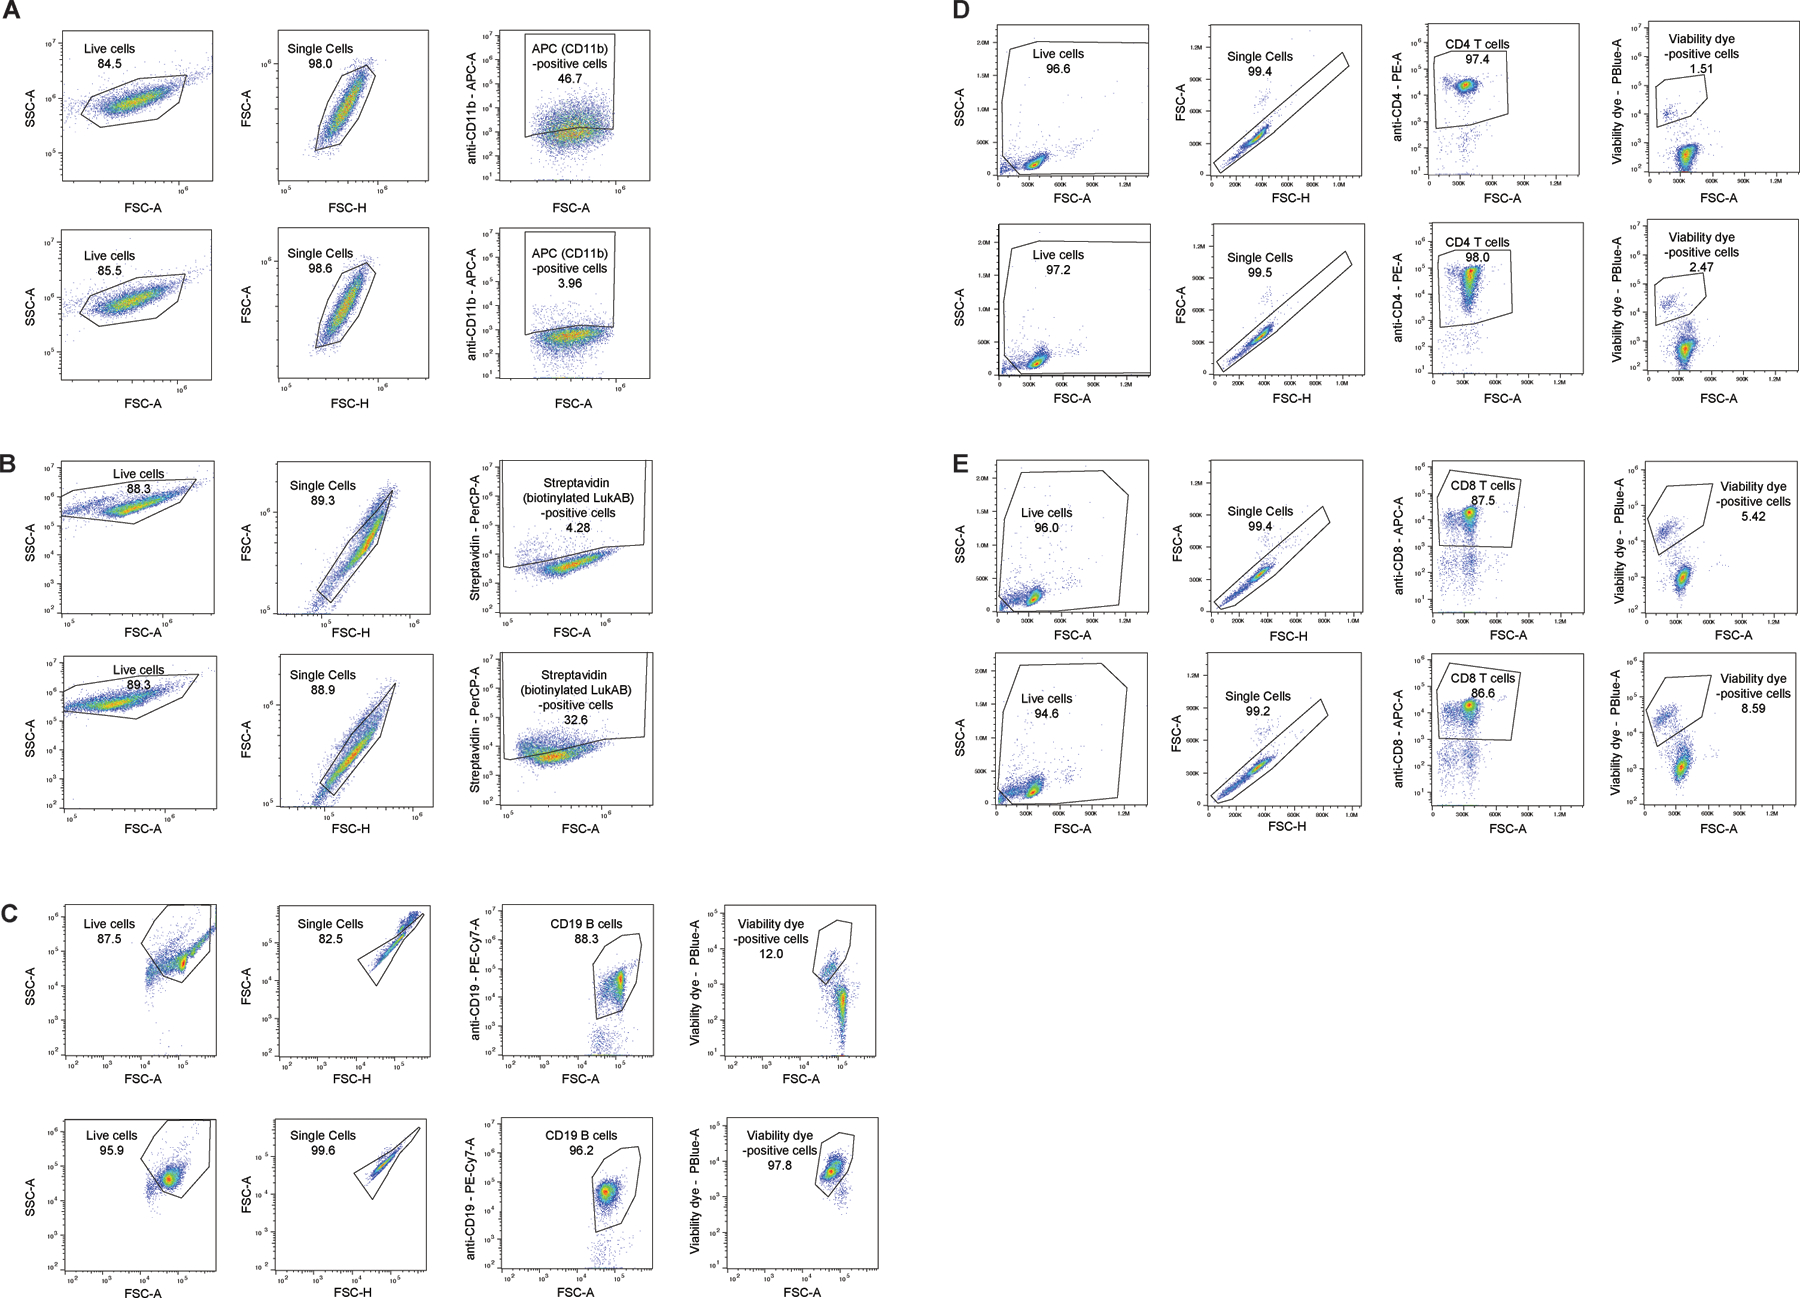
Extended Data Fig. 6. Flow cytometry gating (part 1).

A: Flow cytometry gating scheme utilized to measure surface CD11b levels in scramble shRNA (top) and ITGAM shRNA (bottom) expressing THP1 cell (Figure 2A) using APC-conjugated anti-CD11b antibody.
B: Flow cytometry gating scheme utilized to measure binding of biotinylated LukAB (CC30 LukAB is shown as an example) to CHO cells expressing Fluc (top) or HVCN1 (bottom) using PerCP/Cy5.5-conjugated streptavidin staining (Figures 5B–5C).
C: Flow cytometry gating scheme utilized to measure membrane damage in B cells following treatment with PBS control (top) and LukAB (CC30 LukAB is shown as an example, bottom) using Fixable Viability Dye eFluor™ 450 (Figure 5E).
D-E: Flow cytometry gating scheme utilized to measure membrane damage in CD4-positive (D) and CD8-positive (E) T cells following treatment with PBS control (top) and LukAB (CC30 LukAB is shown as an example, bottom) using Fixable Viability Dye eFluor™ 450 (Figure 5E).
