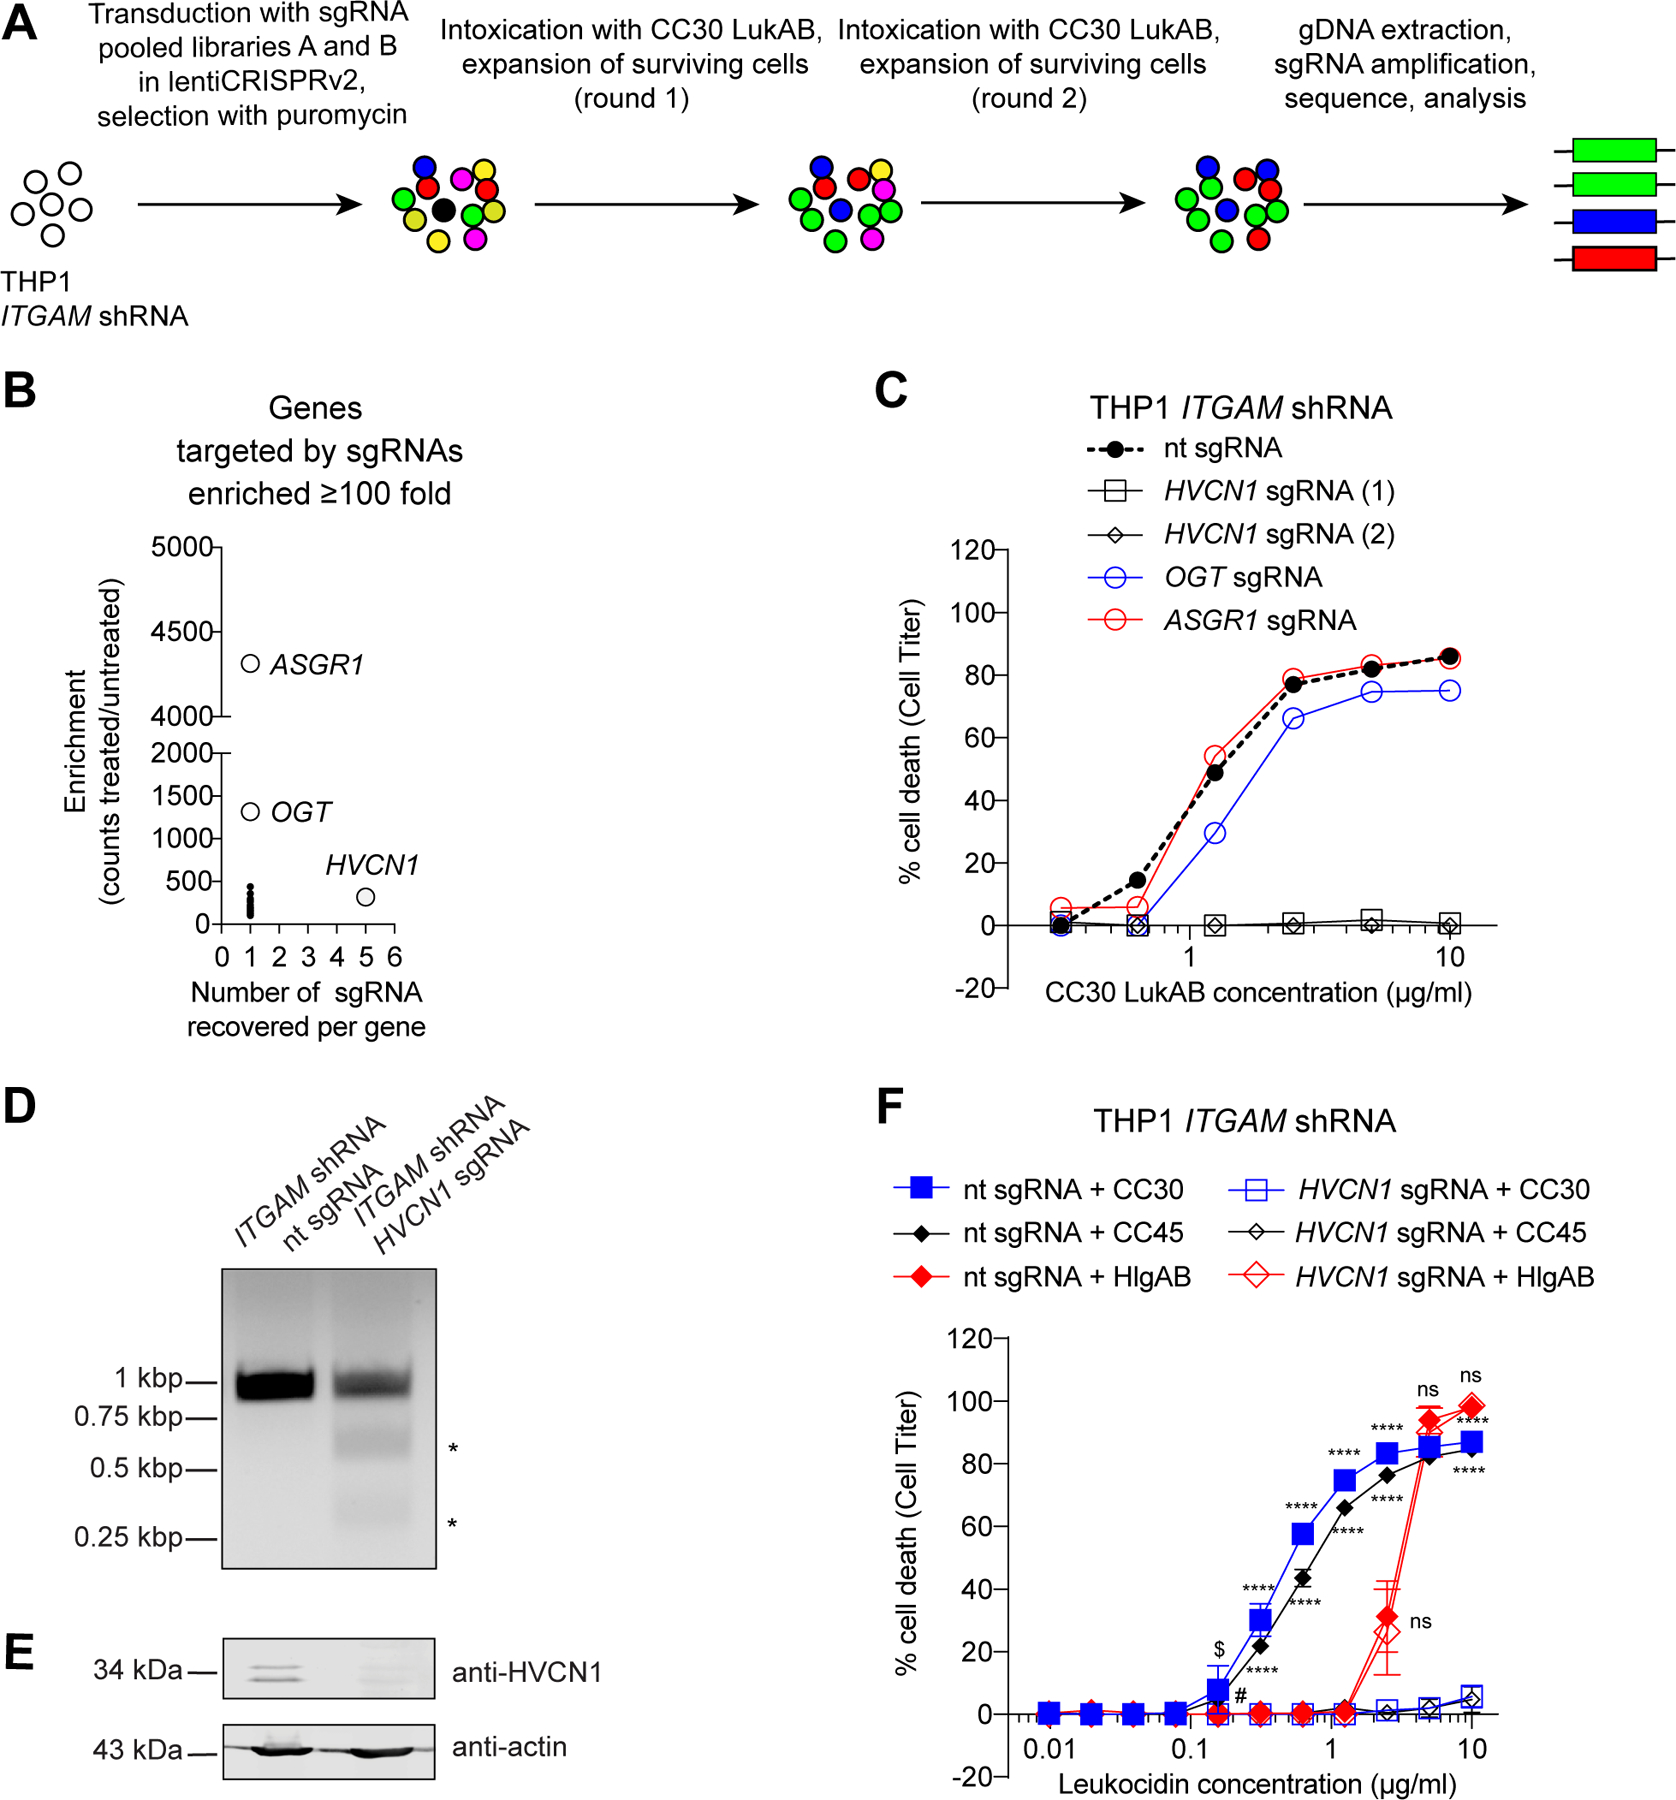
Figure 3. Identification of HVCN1 as a cellular target for the CC30 and CC45 LukAB variants.

A: Schematic of the CC30 LukAB GeCKO screen in ITGAM shRNA THP1 cells. B: Enrichment of specific sgRNAs from the GeCKO library following two rounds of CC30 LukAB selection. Data are presented as the number of sgRNAs significantly enriched in the intoxicated sample versus the average fold enrichment as compared to untreated control. C: Intoxication of ITGAM shRNA THP1 cells transduced with lentiCRISPRv2 expressing sgRNAs targeting indicated genes with CC30 LukAB. Cell viability was measured with Cell Titer. Data are represented as the average of two independent experiments each performed in duplicate. D: Gel image of T7 Endonuclease I-treated HVCN1 PCR products confirming HVCN1 targeting by the sgRNA. HVCN1 was amplified from genomic DNA of ITGAM shRNA THP1 cells transduced with lentiCRISPRv2 expressing non-targeting (nt) sgRNA or HVCN1 sgRNA. Asterisks indicate T7 Endonuclease I cleavage bands. One replicate of this experiment was performed. E: Immunoblot of HVCN1 in ITGAM shRNA THP1 cells transduced with lentiCRISPRv2 expressing non-targeting (nt) sgRNA or HVCN1 sgRNA. Anti-actin immunoblot is shown below as a loading control. Representative image of three independent experiments is shown. F: Intoxication of ITGAM shRNA THP1 cells transduced with lentiCRISPRv2 expressing non-targeting (nt) sgRNA or HVCN1 sgRNA with indicated concentration of CC30 LukAB, CC45 LukAB, and HlgAB. Cell viability was measured with Cell Titer. Data from three independent experiments are represented as mean values ±SD. For each toxin, statistical significance was determined by two-way ANOVA (****, P ≤ 0.0001; $, P = 0.0021; #, P = 0.0072; ns, not significant, >0.9999). Also refer to Supplementary Table 3.
