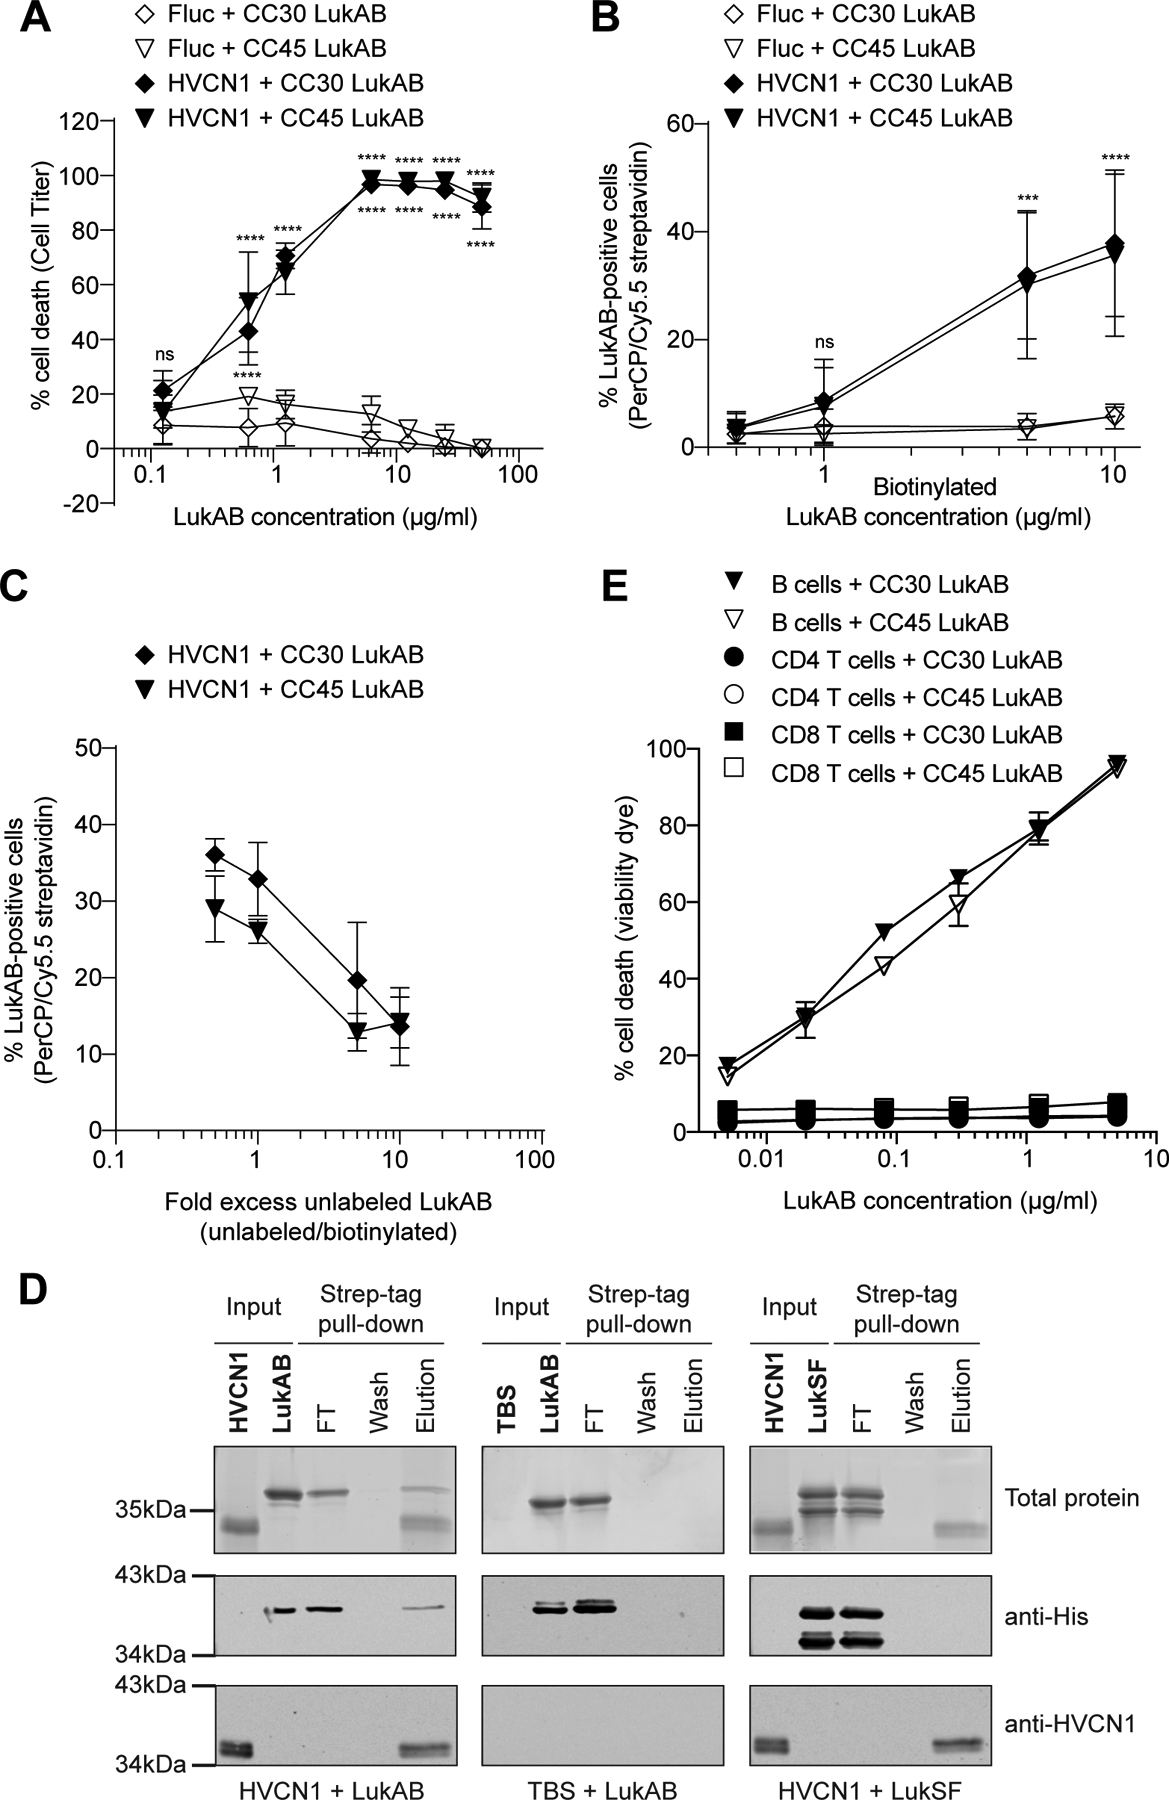
Figure 5. Human HVCN1 mediates CC30 and CC45 LukAB binding and cytotoxicity.

A: Intoxication of CHO cells expressing firefly luciferase (Fluc) or HVCN1 with CC30 and CC45 LukAB. Cell viability was measured with Cell Titer. Data from three independent experiments are represented as mean values ±SD. For each toxin, statistical significance was determined by two-way ANOVA (****, P ≤ 0.0001; ns, not significant). B: Binding of biotinylated CC30 and CC45 LukAB to CHO cells expressing Fluc or HVCN1. Binding was measured by PerCP/Cy5.5 streptavidin staining. Data from three independent experiments are represented as mean values ±SD. For each toxin, statistical significance was determined by two-way ANOVA (****, P ≤ 0.0001; ***, P ≤ 0.001; ns, not significant). C: Binding of biotinylated CC30 and CC45 LukAB (3 μg/ml) to CHO cells transduced with Fluc or HVCN1 in the presence of the indicated excess of unlabeled toxins. Binding was measured by PerCP/Cy5.5 streptavidin staining. Data from three independent experiments are represented as mean values ±SD. D: Pull-down of purified His-tagged LukAB or LukSF with Strep-tagged HVCN1. Input represents resin-bound ligand (HVCN1 or TBS control) and toxin binding partner (LukAB or LukSF). Flow-through (FT), wash, and elution lanes represent fractions from the pull-down after toxin binding (see Methods). Top panel is Sypro Ruby stained SDS-PAGE, middle panel is an immunoblot to detect the toxins, and bottom panel is an immunoblot to detect HVCN1. Representative images of two independent experiments are shown. E: Intoxication of primary human B cells, CD4-T and CD8-T cells with indicated concentrations of CC30 and CC45 LukAB. Membrane damage was detected using Fixable Viability Dye eFluor™ 450. Data from cells isolated from four different donors are represented as mean values ±SEM. Also refer to Extended Data Figure 4.
