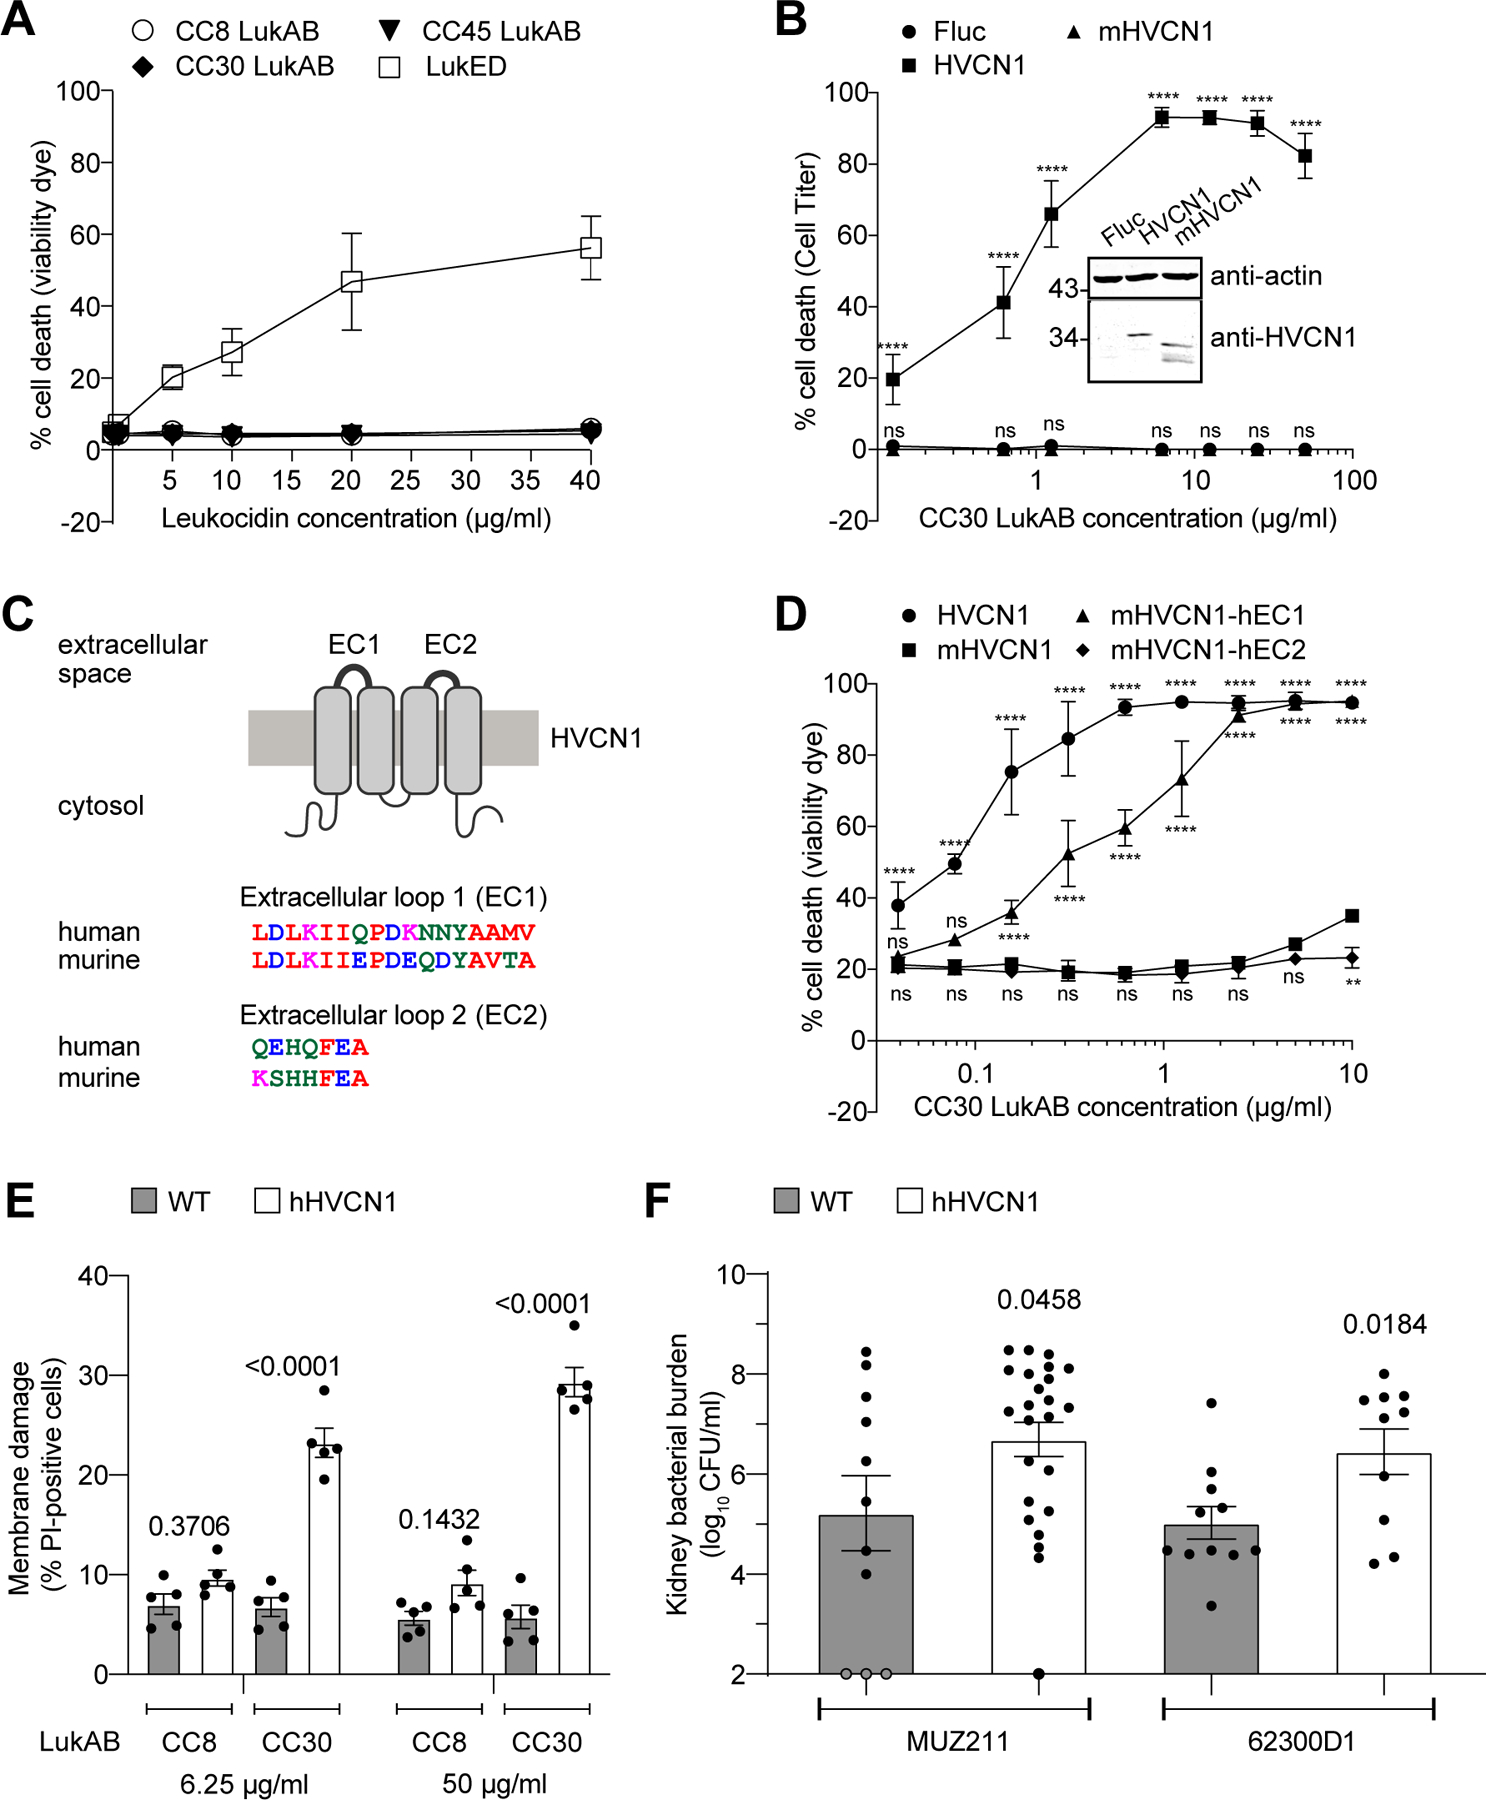
Figure 6. LukAB targeting of HVCN1 promotes S. aureus pathogenesis.

A: Intoxication of murine PECs with indicated concentrations of leukocidins. Membrane damage was detected using Fixable Viability Dye eFluor™ 450. Data are represented as the average of three independent experiments ± SEM B: (inset) Immunoblot of HVCN1 in CHO cells expressing firefly luciferase (Fluc), human (HVCN1) or murine (mHVCN1) HVCN1. Anti-actin immunoblot is shown above as a loading control. Representative images of four independent samples from one immunoblot are shown, see corresponding Source Data for full gel. Numbers on the left indicate migration of the corresponding molecular weight standards (in kDa). Target protein levels normalized by actin were obtained using ImageJ from four independent protein samples: HVCN1 = 0.310 ± 0.111, mHVCN1 = 0.333 ± 0.066 (mean ± SD), P = 0.742 as determined by unpaired t test. (main figure) Intoxication of Fluc, HVCN1, and mHVCN1 expressing CHO cells with indicated concentrations of CC30 LukAB. Cell viability was measured with Cell Titer. Data from three independent experiments are represented as mean values ±SD. Statistical significance was determined by two-way ANOVA (****, P ≤ 0.0001; ns, not significant). C: Schematic architecture of HVCN1 and the amino acid alignments of human and murine extracellular loops generated using Clustal Omega. D: Intoxication of Lenti-X 293T cells expressing C-terminal GFP-tagged human, murine, and chimeric HVCN1 proteins with indicated concentrations of CC30 LukAB. Membrane damage was detected using Fixable Viability Dye eFluor™ 450. Data from three independent experiments are represented as the mean values ±SD. Statistical significance was determined by two-way ANOVA (****, P ≤ 0.0001; **, P ≤ 0.01; ns, not significant). E: Intoxication of PECs from wild type (WT) and hHVCN1 mice with indicated LukAB. Membrane damage was detected using Propidium Iodide (PI) incorporation. Data from five mice per genotype over three independent experiments are represented as mean values ±SEM. Statistical significance was determined by two-way ANOVA, numbers indicate P values. F: CFUs in the kidneys of WT and homozygous hHVCN1 mice infected intravenously with MUZ211 (CFU obtained from 11 WT and 24 hHVCN1 mice) and 62300D1 (CFU obtained from 11 WT and 10 hHVCN1 mice). Data for each isolate are from mice infected over three independent experiments and is represented as mean values ±SEM. Statistical significance was determined by t-test (two-tailed), numbers indicate P values. Also refer to Extended Data Figures 5 and 7.
