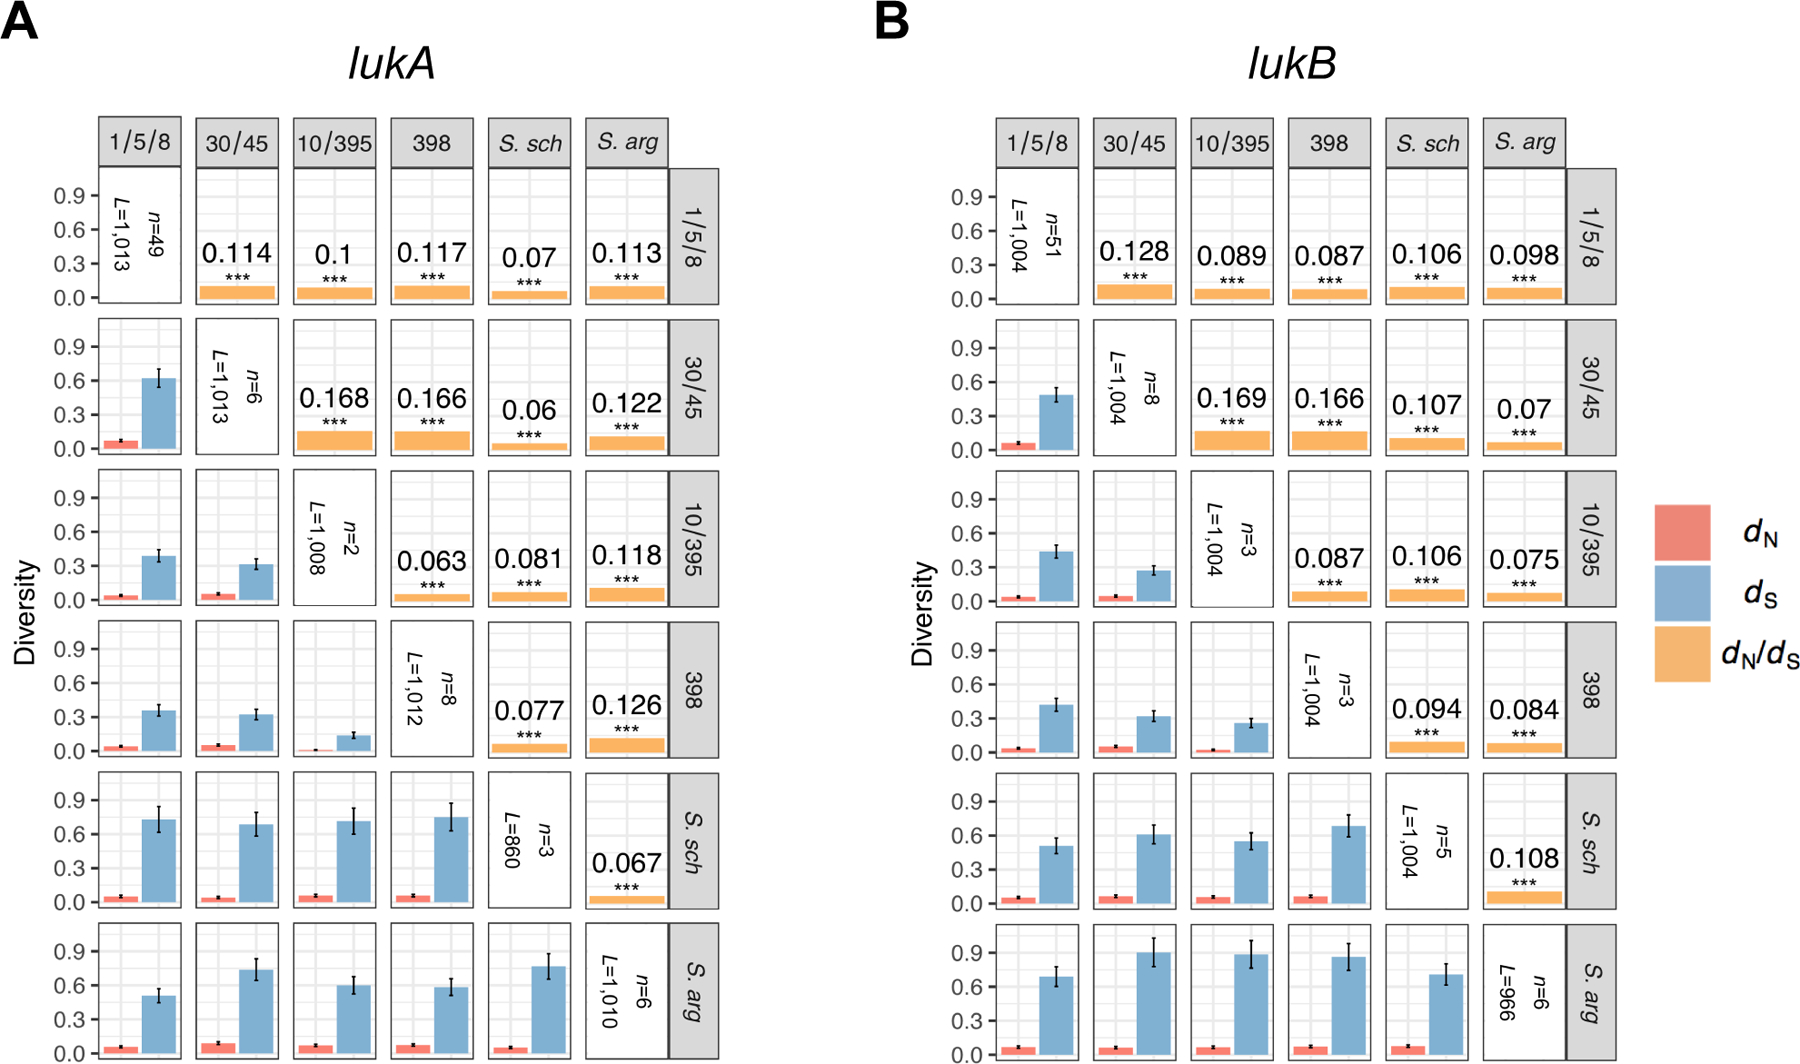
Extended Data Fig. 1. Related to Figure 1.

A-B: Mean between-clade dN and dS values are shown below the diagonal, after applying a Jukes-Cantor correction for multiple substitutions at the same sites. Error bars show the standard error of the mean (SEM), estimated using 10,000 bootstrap replicates (codon unit). Corresponding mean between-clade dN/dS ratios are shown above the diagonal, with significance evaluated using a Z-test of the null hypothesis that dN=dS (10,000 bootstrap replicates, codon unit). All P-values are <1.82×10⁻⁶ (see corresponding Figure Source Data) such that asterisks *** indicate a significance level of 0.0001 after Bonferroni correction. Mean between-clade estimates were derived by comparing each member of one clade to each member of a second clade for all pairs of clades. For lukA, the numbers of taxa (n) and independent aligned codon positions (L) for each clade are n=49 and L=1013 (clade 1/5/8); 6 and 1013 (30/45); 2 and 1008 (10/395); 8 and 1012 (398); 3 and 860 (S. schweitzeri, labeled as S. sch.); and 6 and 1010 (S. argenteus, labeled as S. arg.). For lukB, the numbers of taxa (n) and independent aligned codon positions (L) for each clade are n=51 and L=1004 (clade 1/5/8); 8 and 1004 (30/45); 3 and 1004 (10/395); 3 and 1004 (398); 5 and 1004 (S. schweitzeri); and 6 and 966 (S. argenteus). The number of aligned codon positions (L) are given after eliminating positions with ≤2 defined (non-gap, non-ambiguous) codons in either clade, separately for each between-clade comparison.
