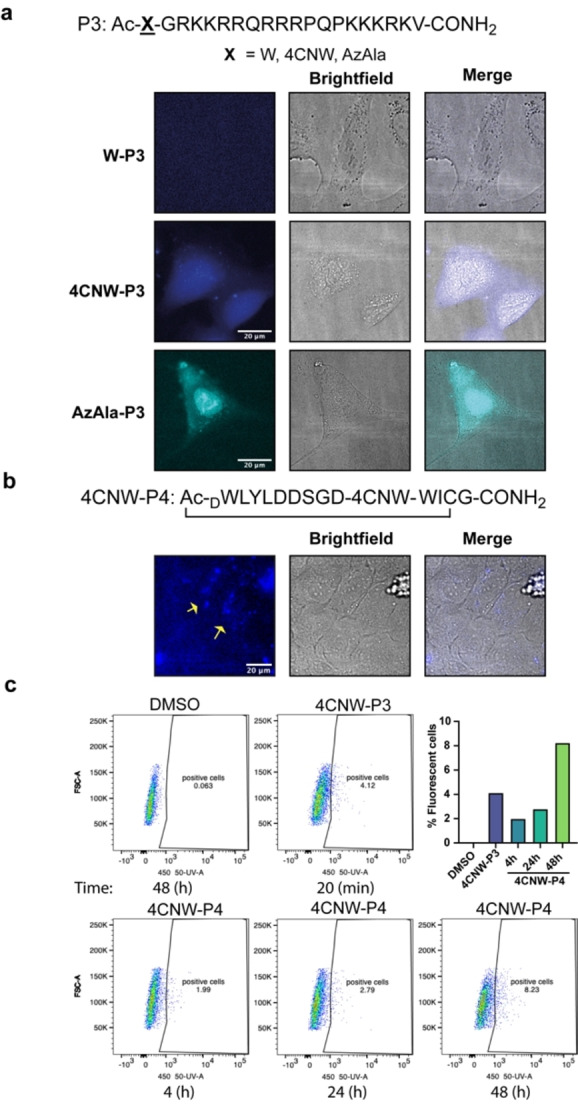
Figure 3.

Uptake of 4CNW/AzAla labelled peptides by living cells. a Live cell fluorescence microscopy images of U2OS cells after 20 min incubation with linear/cyclic peptides (50 μM). Fluorescence of peptides is shown in blue (4CNW) or cyan (AzAla). Scale bar: 20 μm. Images were obtained by using fluorescence excitation at 340 nm with a ET460/50 m (4CNW) or ET395/25x (AzAla) single bandpass emission filter and a Plan Fluor 60x/A1.2 WI. b Live cell fluorescence microscopy images of U2OS cells after 24 h incubation with 4CNW‐P4 peptide (50 μM). Fluorescence of peptides is shown in blue (4CNW). Scale bar: 20 μm. Images were obtained by using fluorescence excitation at 340 nm with a ET460/50 m (4CNW) single bandpass emission filter and a Plan Fluor 40X/1.3NA objective. c Flow cytometry of U2OS cells incubated with DMSO, 4CNW‐P3 or 4CNW‐P4 at the indicated times. Fluorescence of a single cell suspension was acquired with a 355 nm laser, 450‐50 detector and FACS‐Diva software. Numbers indicated in graphs show percentage of positive cells.
