Fig. 2.
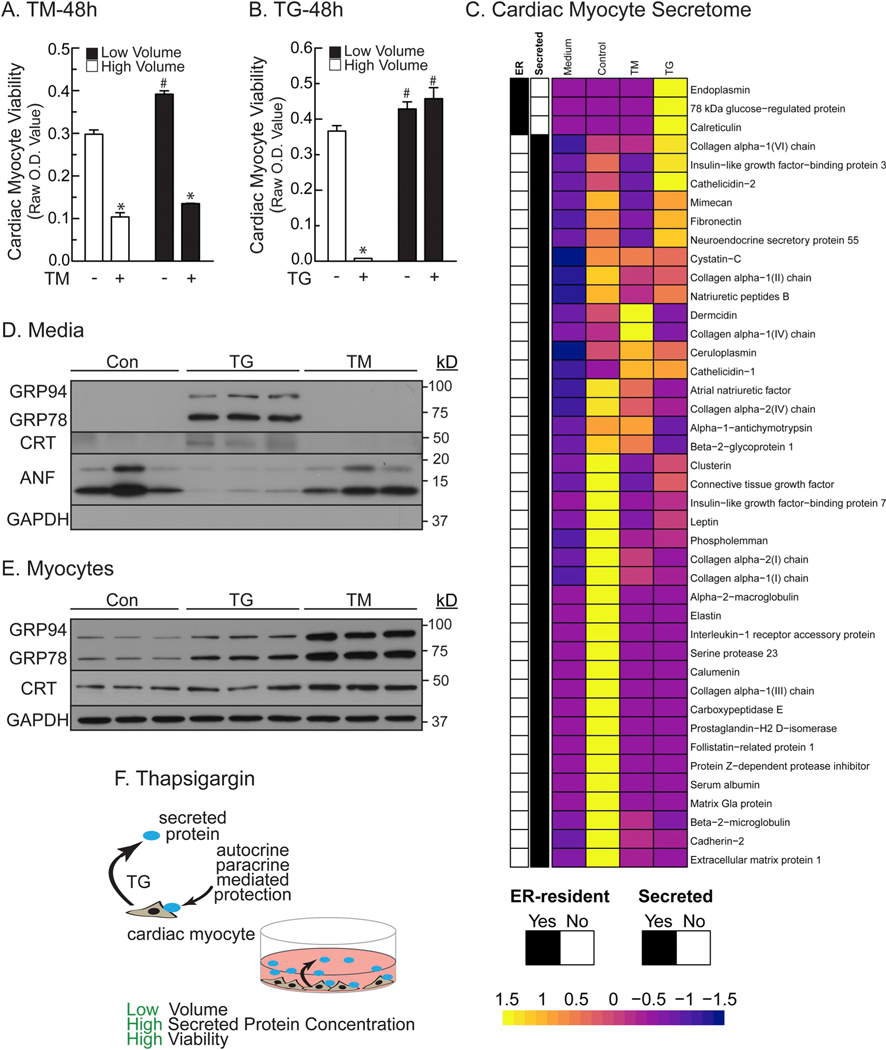
ER Calcium Depletion Uniquely Alters the Cardiac Myocyte Secretome- Panel A- NRVMs were plated at 2.5 × 10⁵ cells/cm2 in 24-well culture dishes, then treated in high (1 ml) or low (0.125 ml) minimal media volumes ± TM (50 μg/ml). After 48 h, culture viabilities were determined by MTT assay. *, # p ≤ .05 different from all other values, as determined by ANOVA followed by Newman Keul’s post hoc analysis. Panel B- NRVMs were plated as in Panel A, except treated ± TG (3 μM). *, # p ≤ .05 different from all other values, as determined by ANOVA followed by Newman Keul’s post hoc analysis. Panel C– Heatmap summary of proteomics findings identified in fresh, unconditioned media (Mdm), media from NRVMs without TG or TM (Con), and media from NRVMs treated with TG or TM. The unit of the scale is not LogFC or FC. The scale shows the z-score of the data that went into the heatmap. In order to generate the heatmap, the original data is scaled. In essence, the scaling computes the z-score, i.e. the input data is transformed in such a way that the mean is zero and the variance is one. This can be seen from the heatmap scale indicator that has its center at 0. Panel D- NRVMs were plated at 1 × 10⁶ cells/6-well culture dish, then treated ± TG (2 μm) or TM (10 μg/ml) in 1 ml serum- and BSA-free media for 24 h. media samples were analyzed directly by immunoblotting for the ER stress-inducible proteins shown using antibodies specific for GRP94, GRP78, CRT, ANF, and GAPDH, as shown. Panel E- Cell extracts from the cultures described in Panel D were examined by immunoblotting. Panel F- Diagram of the hypothetical benefits of proteins secreted in response to TG.

