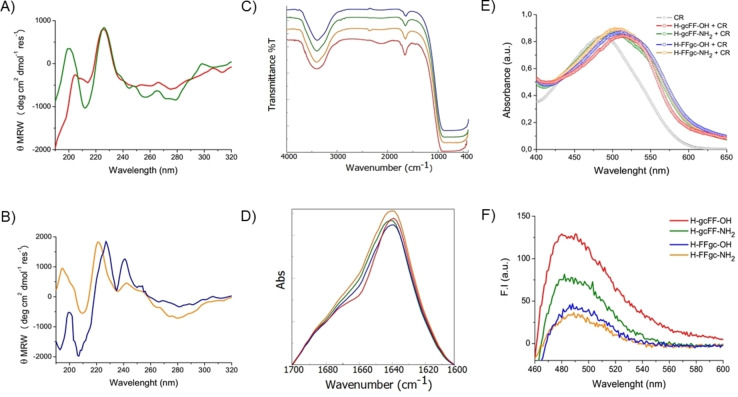
Figure 2.
Secondary structure characterization. A) CD spectra of H−gcFF−OH (red) and H−gcFF−NH2 (green) at 5.0 mg ⋅ mL−1; B) CD spectra of H−FFgc−OH (blue) and H−FFgc−NH2 (orange) at 5.0 mg ⋅ mL−1. C) FTIR spectra of all PNA‐FF derivatives between 4000–400 cm−1. D) Absorbance deconvolution of the FTIR spectra in the amide I region (1700–1600 cm−1) shifted for a better visualization and comparison. E) UV/Vis spectra of PNA‐FF derivatives (2.5 mg ⋅ mL−1) co‐incubated with CR dye. E) Fluorescence spectra of ThT co‐incubated with each PNA‐peptide derivative after the subtraction of both PNA‐peptide and dye alone.

