
Figure 6.
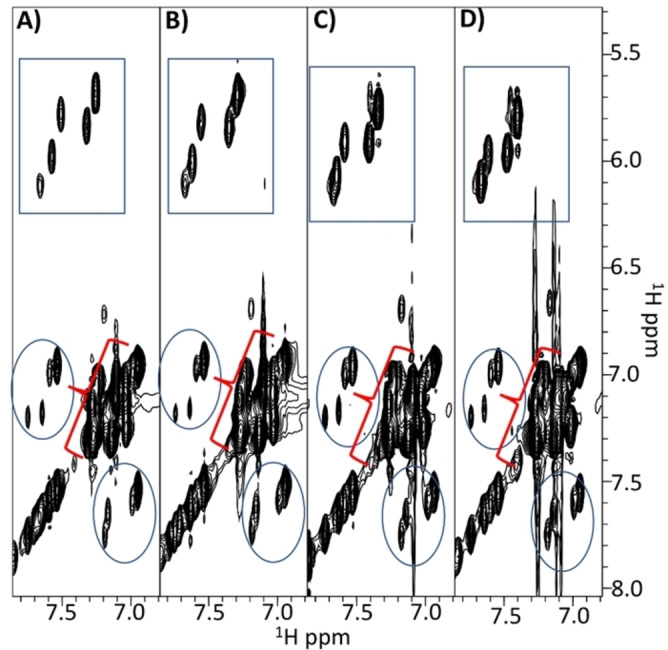
Comparison of 2D [1H, 1H] TOCSY spectra of H−FFgc−NH2 recorded in H2O/D2O 90/10 v/v at different concentrations (A: 1.3 mm, B: 2.6 mm, C: 14.2 mm, D: 46.9 mm). The region containing correlations from aromatic protons and the terminal CONH2 group are reported. Cross‐peaks arising from the H5‐H6 protons of cytosine are enclosed in rectangles, the cycles highlight cross‐peaks from the C‐terminal CONH2 group and the brackets point to cross‐peaks from aromatic protons in Phe residues.