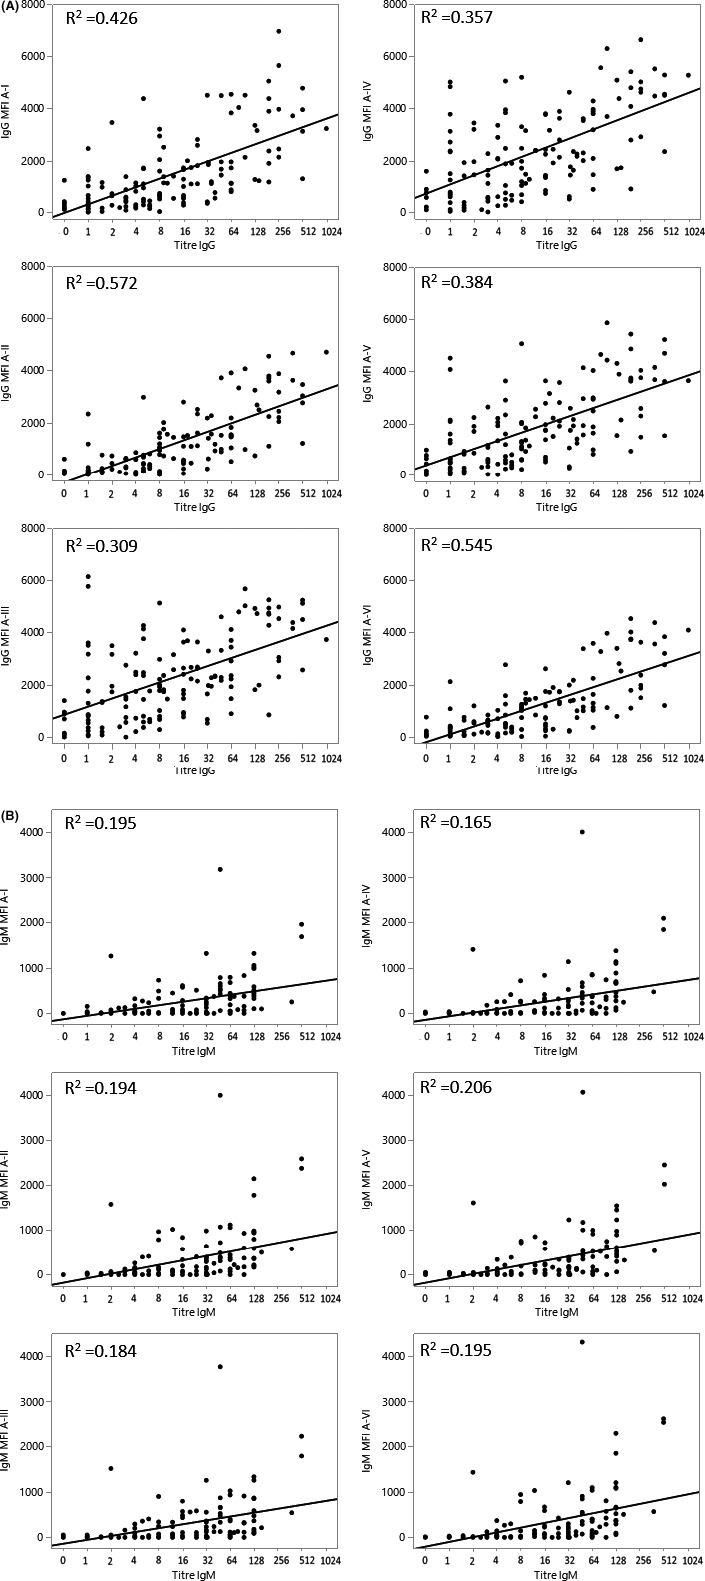
FIGURE 3.

Anti‐A IgG and IgM hemagglutination titers at any timepoint in ABO‐O recipients of ABO‐A kidneys against microarray for each A‐subtype I, II, III, IV, V, and VI. (A) IgG anti‐A titers compared to IgG binding to A‐antigen subtypes. The correlation of hemagglutination IgG titers against A red blood cells in Blood Group O recipients compared to IgG binding to each subtype I, II, III, IV, V, and VI with R 2 .426, .572, .309, .357, .384, and .545, respectively, for each subtype. (B) IgM anti‐A titers compared to IgM binding to A‐antigen subtypes. The correlation of hemagglutination IgM titers against A red blood cells in Blood Group O recipients compared to IgM binding to each subtype I, II, III, IV, V and VI with R 2 .195, .194, .184, .165, .206, and.195, respectively, for each subtype
