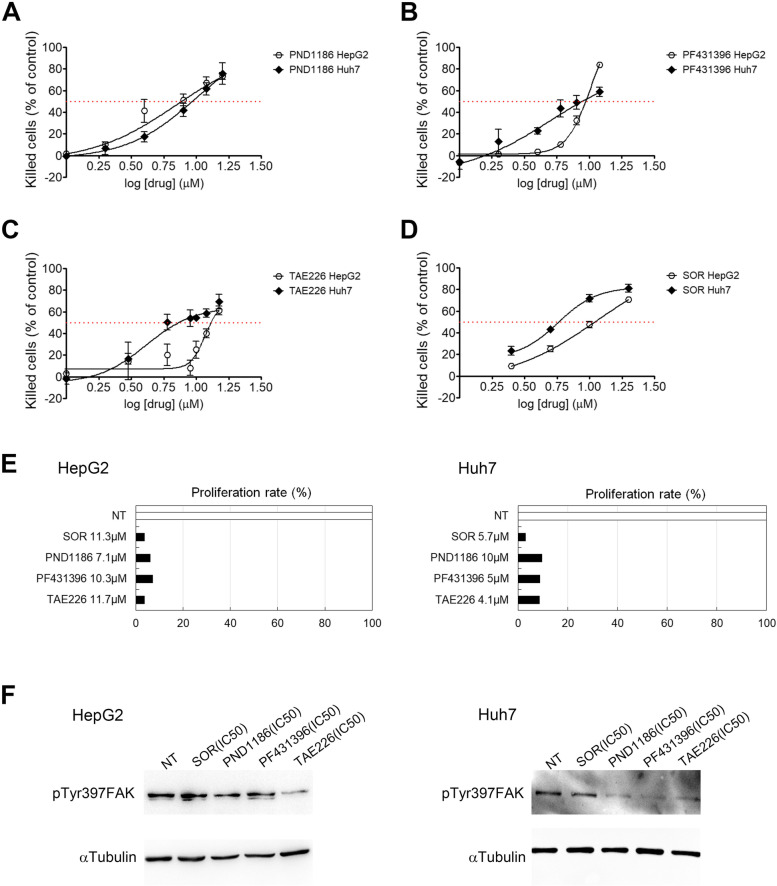
Fig. 1.
Effect of drugs on cell viability, cell proliferation and FAK phosphorylation in HCC cells. Dose-response curves and IC50 fit lane for PND1886 (A), PF431396 (B), TAE226 (C), and SOR (D) in HepG2 and Huh7 cells. Values are measured by XTT assay after 48 h from treatment and expressed as percentage of killed cells respect to NT ± Standard Deviation (SD) of three independent experiments. E Proliferation rate in HCC cells after treatment with IC50 values in HepG2 and Huh7 cells. Values are expressed as percentage respect to NT cells of the mean of at least three independent experiments. F Representative immunoblot by WB of pTyr397FAK expression after 48 h from treatment with the different drugs, in HepG2 and Huh7 cells. αTubulin served as loading control

