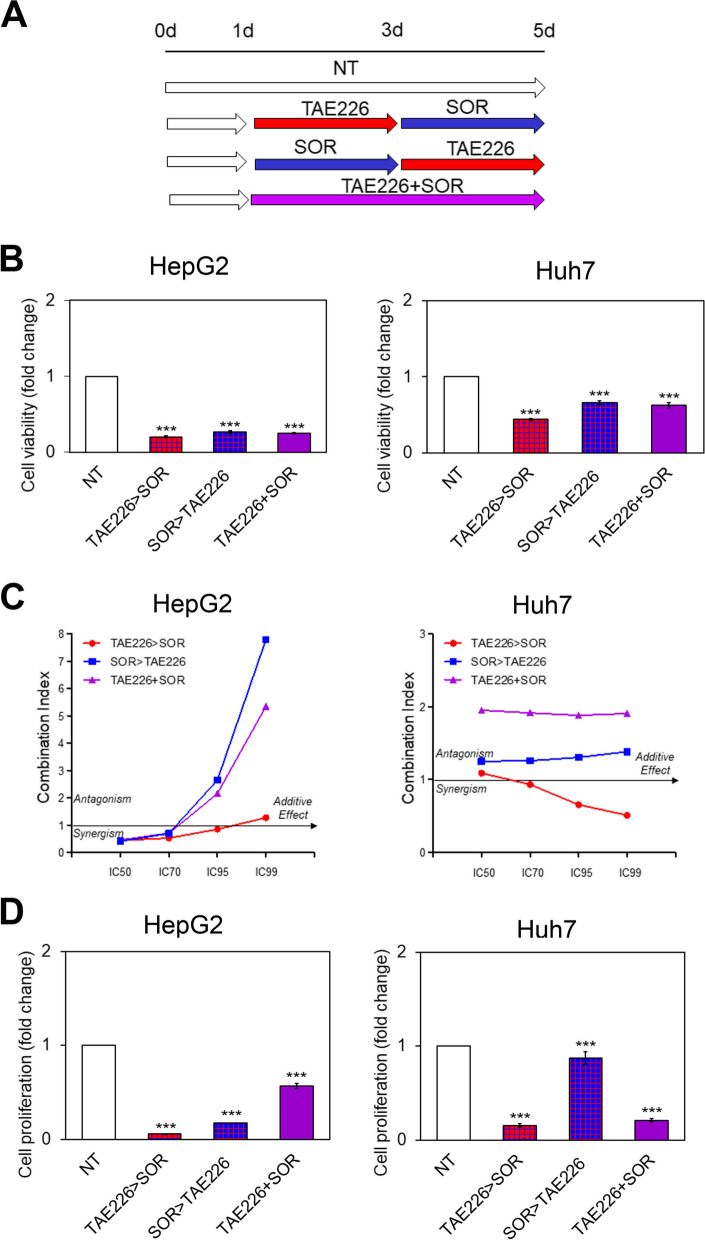
Fig. 2.
Viability and proliferation in HCC cells after treatment with different combination of TAE226 and SOR. A Scheme of the experimental design. B Cell viability was expressed as fold change of absorbance values by XTT assay, in HepG2 and Huh7 cells treated vs. NT. Values are the mean OD ± SD of three independent experiments repeated at least in triplicate. Data were analysed by 2-tailed Student’s t test. ***p < 0.001. C Combination Index (CI) was calculated by the Chou-Talalay method. Data plotted are CI at 50, 70, 95 and 99% fraction killed. D Cell proliferation was expressed as fold change of Europium (Eu) counts of BrdU incorporation in HepG2 and Huh7 cells treated vs. NT. Values are the mean Eu counts ± SD of three independent experiments repeated at least in triplicate. Data were analysed by 2-tailed Student’s t test. ***p < 0.001

