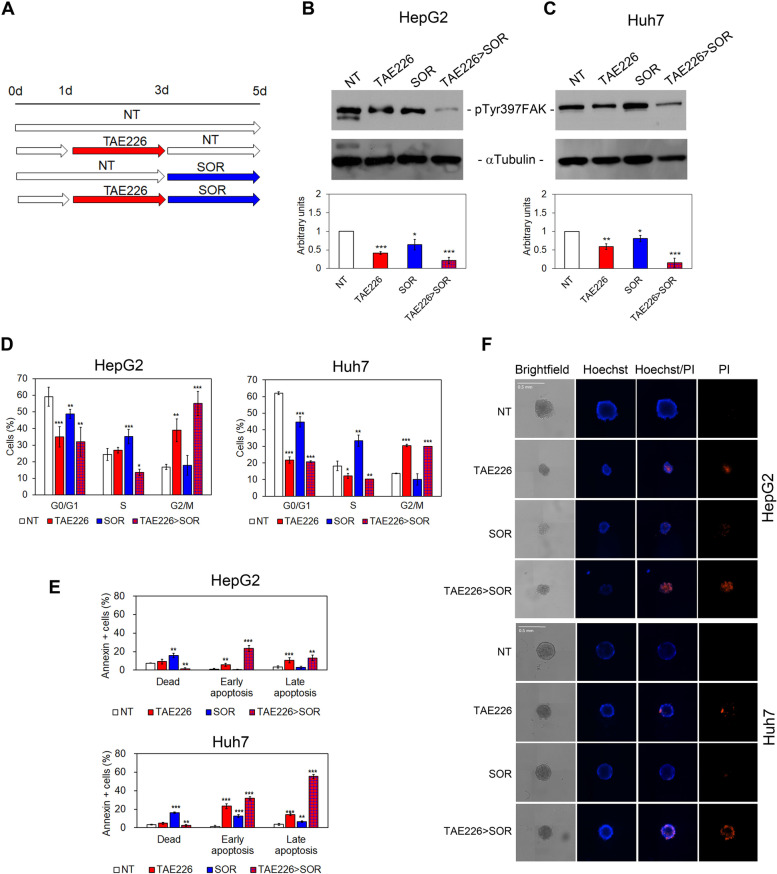
Fig. 3.
Evaluation of pTyr397FAK, cell cycle, apoptosis and TS morphology in HCC cells after TAE226 > SOR treatment. A Scheme of the experimental design. Representative immunoblot and quantitative analysis of pTyr397FAK expression after 48 h from treatment with the different drugs, in HepG2 (B) and Huh7 cells (C). αTubulin served as loading control. Values are the mean arbitrary units ± SD of at least three independent experiments. Data were analysed by 2-tailed Student’s t test. *p < 0.05; **p < 0.01; ***p < 0.001 vs. NT. D Percentage of HCC cells in G0/G1, S and G2/M phase of the cell cycle by PI staining and flow cytometry analysis. Data are expressed as mean ± SD of at least three independent experiments and was analysed by 2-tailed Student’s t test. *p < 0.05; **p < 0.01; ***p < 0.001 vs. NT. E Percentage of HCC cells dead or in early and late apoptosis measured by Annexin V staining and flow cytometry. Data are expressed as mean ± SD of at least three independent experiments and was analysed by 2-tailed Student’s t test. **p < 0.01; ***p < 0.001 vs. NT. F Representative brightfield and fluorescent images (Hoechst and PI) of multicellular TS from HepG2 and Huh7 cells NT and after treatments

