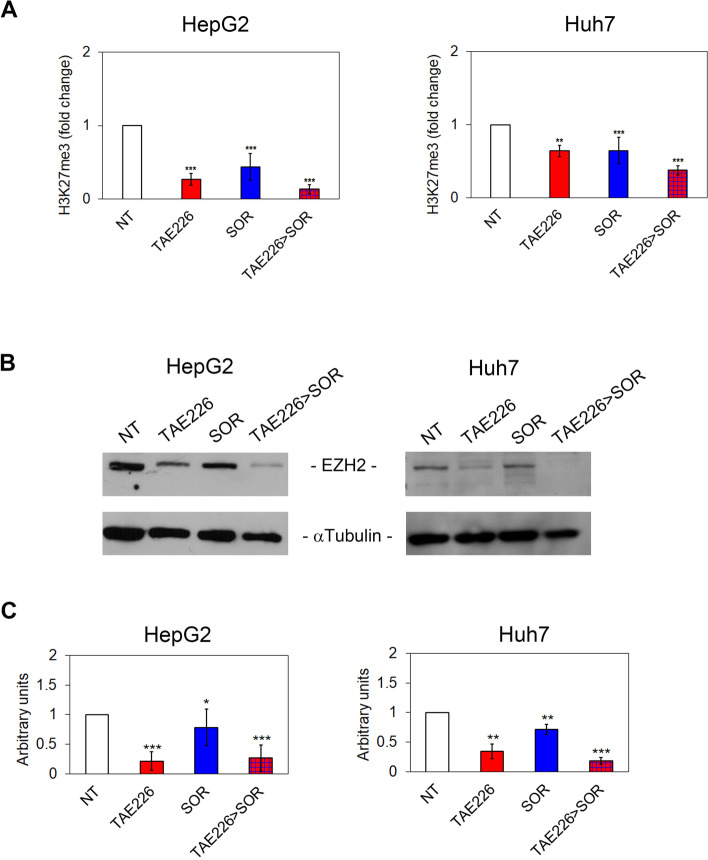
Fig. 6.
Effect of TAE226 > SOR on H3K27me3. A H3K27me3 levels measured by AlphaLISA assay and represented as fold change in HepG2 and Huh7 cells treated vs. NT. Data were analysed by 2-tailed Student’s t test. **p < 0.01; ***p < 0.001 vs. NT. Representative immunoblot (B) and quantitative analysis (C) of EZH2 expression after treatments, in HepG2 and Huh7 cells. αTubulin served as loading control. Values are the mean of arbitrary units ± SD of at least three independent experiments. Data were analysed by 2-tailed Student’s t test. *p < 0.05; **p < 0.01; ***p < 0.001 vs. NT

