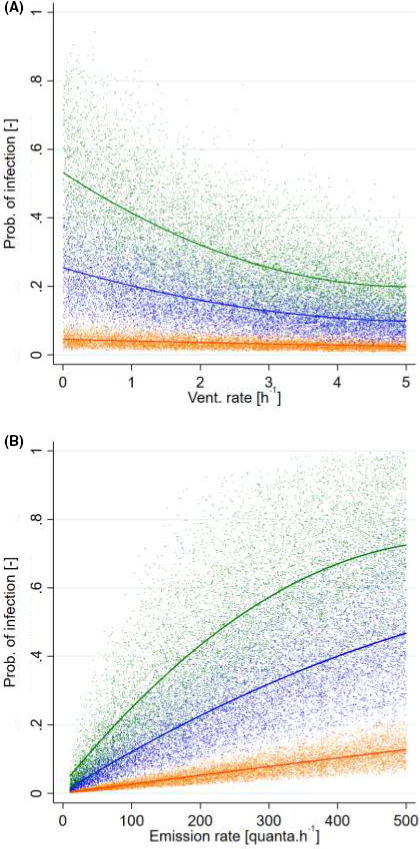
FIGURE 4.

(A) Probability of infection simulated in a 150 m3 room for various loss rate due to ventilation (λv) and event duration: orange: 0.5 h, blue 1.5 h, green 3 h (n = 30 000). (4B) Probability of infection simulated in a 150 m3 room for various emission rates E and event duration: orange: 0.5 h, blue 1.5 h, green 3 h (n = 30 000)
