Abstract
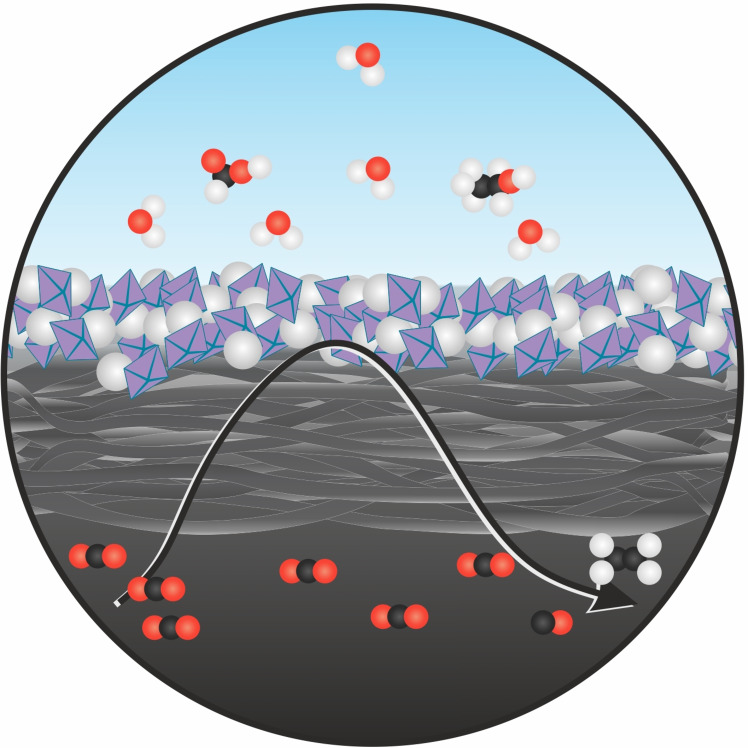
Developing highly efficient and selective electrocatalysts for the CO2 reduction reaction to produce value‐added chemicals has been intensively pursued. We report a series of Cu x O y C z nanostructured electrocatalysts derived from a Cu‐based MOF as porous self‐sacrificial template. Blending catalysts with polytetrafluoroethylene (PTFE) on gas diffusion electrodes (GDEs) suppressed the competitive hydrogen evolution reaction. 25 to 50 wt % teflonized GDEs exhibited a Faradaic efficiency of ≈54 % for C2+ products at −80 mA cm−2. The local OH− ions activity of PTFE‐modified GDEs was assessed by means of closely positioning a Pt‐nanoelectrode. A substantial increase in the OH−/H2O activity ratio due to the locally generated OH− ions at increasing current densities was determined irrespective of the PTFE amount.
Keywords: CO2 reduction, electrocatalysis, gas diffusion electrode, local pH-value, metal-organic frameworks
A series of nanostructured Cu x O y C z electrocatalysts were synthesized from Cu‐based MOF precursors. The catalysts were blended with PTFE for preparation of gas diffusion electrodes (GDEs) to suppress hydrogen evolution by preventing electrowetting process. The local OH− ion activities of working GDEs were determined in absence and presence of PTFE to exclude interference in local OH− ion generation in the vicinity of GDE by PTFE.
Introduction
The electrochemical CO2 reduction reaction (CO2RR) is one of the most promising technologies to convert CO2 directly into useful chemical feedstocks or fuels. [1] However, CO2RR is conceptually complex and impacted by a large number of parameters such as catalyst structure, CO2 mass transport, pH value in the immediate environment of the catalyst, often leading to poor selectivity, high overpotentials, loss of catalytic activity, and competition with the hydrogen evolution reaction (HER). Cu represents the most investigated catalyst for CO2RR facilitating C−C‐bond formation and hence selectivity pathways leading ultimately to the synthesis of multi‐hydrocarbon (C2+) products and oxygenates. Therefore, designing and engineering Cu‐based catalysts aiming for enhanced CO2RR activity and selectivity is often pursued.[ 2 , 3 ] Oxide‐derived Cu nanostructures were effective for the conversion of CO2 into C2+ products and oxygenates due to in situ generation of hetero surface structures with numerous active sites such as mixed‐valence CuI/Cu0 states during electrolysis.[ 4 , 5 ] The reaction selectivity strongly depends on the synthetic routes during catalyst synthesis. Pyrolysis of porous templates such as metal‐organic frameworks (MOF) is one of the promising strategies for the synthesis of materials for supercapacitors, batteries, water splitting electrolyzers, etc. due to their high surface area to volume ratio, well defined morphology and compositional tunability. [6] However, MOF‐based electrocatalysts are underrepresented in CO2RR studies[ 3 , 4 , 7 ] and henceforth, for novel catalysts synthesis purpose, exploring various synthetic parameters is highly desirable.
A major development which allows improvement of CO2 mass transport is due to the transition from H‐type electrochemical cells comprising of a CO2‐saturated KHCO3‐based electrolyte towards gas diffusion electrode (GDEs) in flow cells, enabling a thinner mass‐transfer boundary layer of approximately ≈50 nm.[ 8 , 9 ] CO2 is flowing from the backside of GDEs to the three‐phase boundary, thus increasing the CO2 conversion rate and improving partial current densities of the envisaged products.
Electrolyte induced wetting of the catalyst layer, apart from providing the protons required for C2+ formation, also facilitates the HER which is competing with CO2RR in the same potential window. Therefore, minimizing electrowetting effects and avoiding electrode flooding are crucial parameters to regulate the selectivity for CO2RR products.[ 9 , 10 ] Hence, hydrophobic polymers or ionomers, for example, polytetrafluoroethylene (PTFE) were mixed into the catalyst layer. [11] Despite clearly having an impact on the electrode performance, only limited understanding of the factors influencing catalysis are available. We expect that the addition of PTFE modulates electrowetting of the catalyst surface and influences the interfacial local pH value which in turn will affect the rate determining step and product selectivity.[ 12 , 13 , 14 , 15 , 16 ] Besides this, the CO2 mass transport inside the catalyst layers may also be influenced by the presence of hydrophobic additives. However, under conversion at high current densities, the mass transport of both CO2 as well as H2O needs to be considered. Continuous consumption of H2O from the liquid/solid interface results into local accumulation of OH− ions, thus elevating the local pH value. A recent theoretical study showed that the local pH value may vary up to six units higher than the pH value in bulk solution, depending on the diffusion layer of the electrode, applied current density and the electrolyte buffer capacity. [17] So far, understanding the role of the local pH value was rarely quantitatively addressed due to the challenges to experimentally investigate surface processes, especially in porous systems such as GDEs. The few reports use either theoretical[ 14 , 15 ] or spectroscopic[ 12 , 13 ] approaches or the effluent solution. [16] Recently, we proposed a scanning electrochemical microscopy (SECM) approach for determining the local OH− ion and H2O activities in close proximity to a GDE during the oxygen reduction reaction and CO2RR.[ 18 , 19 , 20 ] In both cases, a drastic increase in the OH−/H2O activities ratio near the electrode surface was observed.
In this work, we report synthesis of a series of novel nanostructured Cu x O y C z electrocatalysts using a Cu‐based MOF (HKUST) [21] as self‐sacrificial template. Pyrolysis of HKUST was performed at different temperatures (400, 600, 800, and 1000 °C in O2/Ar gas mixture) providing variations in the structure and composition of the catalysts. Pyrolysis in O2/Ar atmosphere led to the removal of excess carbon residues. The influence of pyrolysis temperature on these resulting catalysts and their CO2RR activities were investigated. Different amounts of PTFE were added into the catalyst layer during GDE preparation to elucidate its impact on promoting the CO2RR over HER. [22] Modification with PTFE enabled control of surface wetting and caused a significant improvement in the Faradaic efficiency (%FE) of multi‐hydrocarbon C2+ products. The impact of PTFE on the local OH− concentration and on the CO2RR was further studied using SECM‐based positioning of a Pt nanoelectrode in close proximity to the working GDE surface to assess OH−/H2O activities close to the PTFE supported or unsupported GDE/electrolyte interface to link the reaction selectivity with the locally modulated pH values during CO2RR.
Results and Discussion
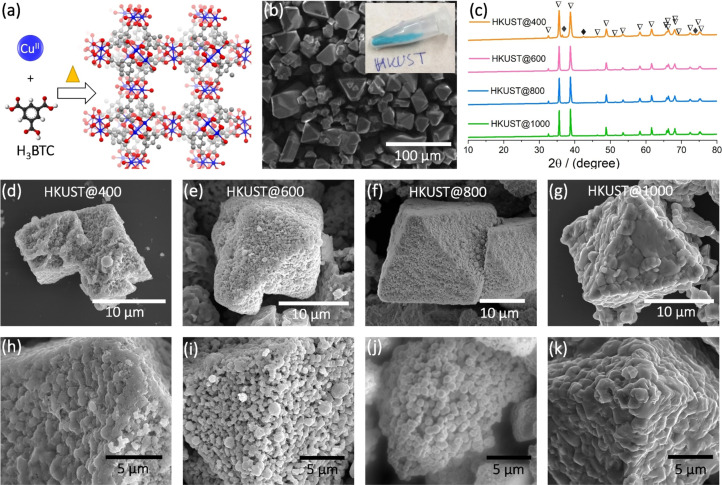
Single crystals of the Cu‐MOF HKUST were synthesized by a solvothermal method in DMF, EtOH and water mixture at 70 °C using Cu2+ and the organic linker H3BTC (see SI) (Figure 1 a,b). The obtained crystals were pyrolyzed at 400, 600, 800 and 1000 °C under O2/Ar atmosphere to synthesize a set of Cu x O y C y catalysts. The phase purity and crystallinity of HKUST and the derived catalysts were assessed by powder X‐ray diffraction (PXRD) analyses which confirmed the formation of a crystalline CuO phase (ICDD: 00‐048‐1548) (Figure 1 c and S1). The strong Bragg reflexes indicate high crystallinity of the MOF and derived catalysts. In the case of HKUST@400, three reflexes with lower intensity were observed at 2θ values of 36.4°, 42.3° and 73.5° which correspond to the (111), (200), and (311) of crystalline Cu2O phase (ICDD: 01‐071‐3645). Scanning electron microscopy (SEM) images revealed that the pyrolysis process preserved the octahedral shape of the HKUST MOF (Figure 1 d–k). The octahedral microparticles have dimensions of 20±10 μm (edgewise) and exhibit a porous surface texture, probably formed during pyrolysis. [4] The histograms of average particle size distributions showed a broad size distributions with peak maxima at ≈460, 410, and 330 nm for HKUST@400, HKUST@600 and HKUST@800, respectively (Figure S2). The histograms also suggest formation of smaller sized nanoparticles of <50 nm. HKUST@1000 showed predominately agglomerated particles with an estimated average particle size value of ≈915 nm.
Figure 1.
(a) 3D structural view of Cu‐MOF, HKUST (in ball and stick model, blue: Cu centers, red: O, gray: C, white: H; (b) SEM image of as‐synthesized HKUST crystals; (c) PXRD data of HKUST@400, HKUST@600, HKUST@800 and HKUST@1000, the hollow triangle symbol and filled rhombus symbol represent CuO and Cu2O, respectively; (d–k) SEM images of HKUST@400, HKUST@600, HKUST@800 and HKUST@1000 at different magnifications.
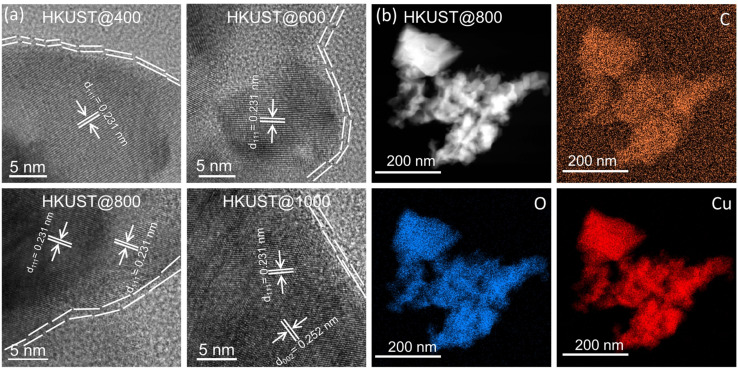
A more in‐depth investigation using transmission electron microscopy (TEM) and energy‐dispersive X‐ray spectroscopy (EDS) for elemental mapping confirmed the formation of Cu x O y nanoparticles wrapped within thin carbon (C) layers (Figure 2), indicating a plausible composition of Cu x O y C z . The high crystallinity of the Cu x O y C z nanoparticles was confirmed by means of high‐resolution TEM (HRTEM) images (Figure 2 a). The arrangement of periodic lattice fringes with d‐spacing values of 0.231 and 0.252 nm corresponds to the (111) and (002) facets of CuO, respectively. [23] The thickness of the peripheral C‐layer was 2 to 4 nm. The presence of carbon was also confirmed in the TEM‐EDS elemental color mapping images (Figure 2 b and S3–S5). To understand the oxidation states and nature of the elements, surface analysis of the catalyst powders was performed by X‐ray photoelectron spectroscopy (XPS) (Figure S6–S9; see also Figure 5 e). For all HKUST‐based catalysts, the main deconvoluted core level Cu 2p3/2 is CuO, which has broad characteristic satellite peaks in the range of 940 to 944.2 eV, also in agreement with the PXRD data. [24] During the fitting process, minor contributions attributed to Cu0 (at 932.5±0.1 eV) and CuII from hydroxides can be obtained. Still, their integral area is below the detection limit of the instrument, and therefore was not further used for interpretation. The broad O 1s peak in the range of 529.5 to 533.2 eV was deconvoluted into four oxygen species. The peak located at 529.6±0.1 eV is due to O 1 s of CuO, [25] while the others are assigned to oxygen containing moieties, such as C=O and C‐O. The C 1s core level peak was deconvoluted into five peaks. The main component at 284.8 eV corresponds to C−C bond, [25] while the peaks at higher binding energy values indicate ‐C‐O, ‐C=O, ‐CO2H functionalities associated with the carbon layer. Elemental analysis was performed for quantifying the amount of carbon to be 0.07, 0.1, 0.09 and 0.03 wt % for HKUST@400, HKUST@600, HKUST@800 and HKUST@1000, respectively. The N2 adsorption isotherms for HKUST@600 and HKUST@800 showed type‐III adsorption profiles with poor N2 uptake of 2.6 and 3.2 cm3 g−1 at 77 K (Figure S10). Since, these catalysts are non‐porous, the BET area of HKUST@400 and HKUST@1000 was not determined. The non‐porousity may be due to the absence of a large porous carbon matrix which is the basis for the formation of micro‐ and macropores. [26]
Figure 2.
(a) HRTEM images of as synthesized Cu x O y C z nanoparticles: HKUST@400, HKUST@600, HKUST@800 and HKUST@1000, the thin C layers wrapping the Cu x O y nanoparticles are seen in the images; (b) TEM‐EDS elemental color maps of HKUST@800 nanoparticles showing the presence of C, O and Cu.
Figure 5.
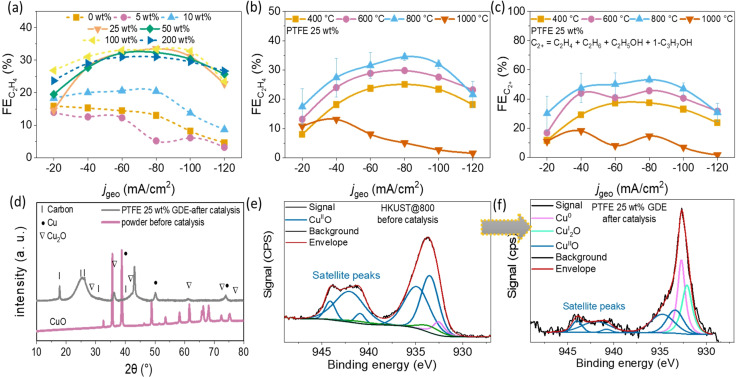
(a) %FE as a function of j geo for HKUST@800 GDEs without or with different PTFE loadings; (b) %FE and (c) %FE as a function of j geo recorded using GDEs containing pyrolyzed HKUST catalysts at different temperatures mixed with 25 wt % PTFE; (d) comparison of PXRD data of as‐synthesized HKUST@800 powder (not added on GDE) and 25 wt % PTFE/catalyst‐modified GDE after CO2RR; (e,f) a comparison between core level Cu 2p3/2 XPS plot for as synthesized HKUST@800 powder and 25 wt % PTFE‐modified GDE, before and after CO2RR catalysis.
Electrochemical CO2 reduction
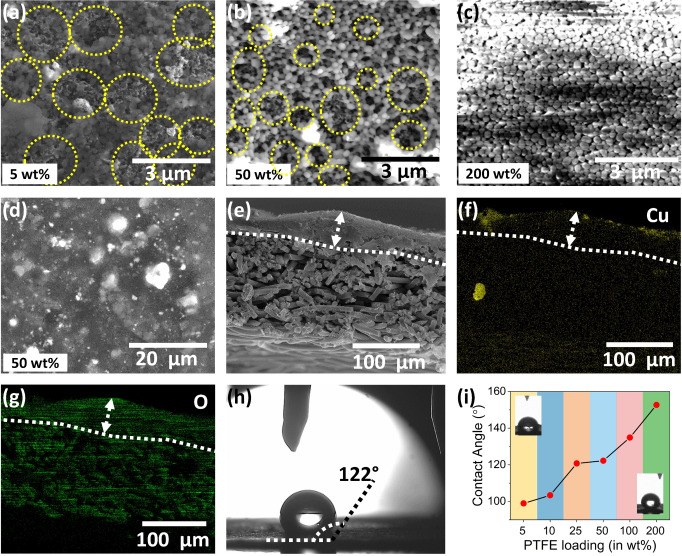
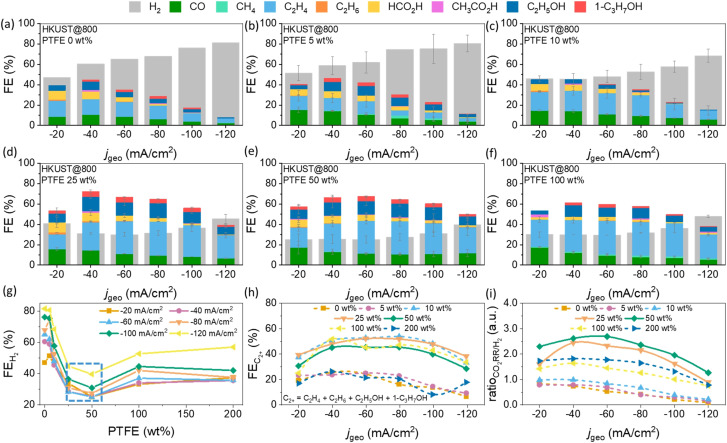
CO2 electroreduction activity and selectivity of as‐prepared HKUST@400, HKUST@600, HKUST@800 and HKUST@1000 were obtained under steady‐state conditions by means of constant‐current electrolysis, that is, chronopotentiometry, in 1 M KOH solution in a custom‐made three compartments cell under constant CO2 flow. The details of the cell design and product collection are shown in Scheme S1. The catalyst inks were prepared by dispersing the catalyst powders in EtOH in the absence or presence of varying PTFE amounts by means of ultrasonication. Specific volumes of the ink were drop‐casted on the microporous hydrophobic side of a carbon GDE to obtain a final mass loading of ≈1 mg cm−2. During ultrasonication, the octahedral particles tend to disintegrate into smaller sized nanoparticles and spread over the GDE surface, which is most likely due to an insufficient carbon matrix to embed the metal‐oxide nanoparticles (Figure S11). We used on‐line gas chromatography (GC) and high‐performance liquid chromatography (HPLC) to detect and quantify the gaseous and liquid products generated at each current density during a set of six successive chronopotentiometric experiments with current densities (j geo) from −20 to −120 mA cm−2 with −20 mA cm−2 increments. Each current was applied for 870 s followed by a galvanostatic electrochemical impedance spectroscopy (EIS) measurement at the same current density. For all catalysts (HKUST@400, HKUST@600, HKUST@800 and HKUST@1000) without PTFE (0 wt % PTFE), besides the CO2RR products, a significant amount of H2 was evolved (Figure S12). Since H2 is obtained via water electrolysis, it was assumed that increasing the hydrophobicity of the catalyst layer on top of the microporous carbon layer may promote CO2RR over HER by decreasing the catalyst layer wettability. To achieve this, the PTFE (≈1 μm particle size) was mixed into the catalyst ink in mass ratios from 5 to 200 wt % with respect to catalyst loading. Since HKUST@800 showed the lowest %FE for H2 formation, optimization of the catalyst to PTFE ratio was initially performed using this catalyst. Increasing the PTFE amount in the HKUST@800 catalyst layer led to roughening of the GDE surface and to the formation of PTFE/catalyst junctions, marked in yellow circles in Figure 3 a,b and S13–S17. Without PTFE addition, such surface structures were not created (Figure S11). The average thickness of the catalyst layers was in the range of 50±20 μm and the PTFE microparticles were homogeneously distributed on the electrode surfaces (Figure 3 and S13–S17). The average PTFE surface coverage increased substantially with increasing PTFE amount and hence controls the exposed active catalysts surface areas (yellow circles in Figure 3 and S13–S17). The addition of PTFE microparticles may act as protective layer for electrowetting and build interfacial PTFE/catalyst gas diffusion microchannels. Moreover, since CO2 is non‐polar, facilitated gas diffusion pathways across the layer appear preventing HER by limiting the diffusion of OH− ions and water. Contact angle measurements were performed with PTFE‐modified HKUST@800 GDEs. The addition of increasing amounts of PTFE to GDEs led to an increased hydrophobicity. The measured contact angles were 99°, 103°, 121°, 122°, 135°, and 153° for PTFE loadings of 5, 10, 25, 50, 100, and 200 wt %, respectively (Figure 3 i). For HKUST@800 with 0 wt % PTFE, H2 (major product, from 47 to 81 %FE), CO, C2H4, a minute amount of CH4 and C2H6 were the gaseous products together with ≈4 to 20 %FE of liquid products namely C2H5OH, 1‐C3H7OH, HCO2H and CH3CO2H (Figure 4 a and S12). The predominant HER and the minor contribution of CO2RR is plausible due to an excessive wetting of the catalyst surface in the absence of PTFE. At 5 wt % PTFE in the catalyst layer, the %FE did not change significantly as compared to 0 wt % PTFE (Figure 4 a,b). However, the CO2RR products showed a small increase in the formation of CO and CH4 as well as a decrease of C2H4.
Figure 3.
Images of GDEs with HKUST@800 catalyst: SEM images of (a) 5 wt %, (b and d) 50 wt %, and (c) 200 wt % PTFE‐modified GDE surfaces (the round yellow circles represent PTFE/catalyst heterojunctions); (e) cross section SEM image of 50 wt % PTFE‐modified GDE; (f,g) SEM‐EDS elemental color map showing the distribution of Cu and O; (h) contact angle value determination on the same GDE; (i) plot of contact angle values vs. PTFE loading.
Figure 4.
(a–f) HKUST@800: %FE of the obtained products on the electrodes containing different PTFE loadings (0, 5, 10, 25, 50, and 100 wt %) at different current densities (j geo), in 1 M KOH; (g) %FE generated in the presence of different PTFE loadings, blue box indicates lowest H2 production in the range of 25 to 50 wt % PTFE; (h) %FE and (i) ratio calculated for GDEs containing different PTFE loadings depending on the applied current densities.
Interestingly, 10 wt % PTFE‐modified GDE did reveal an altered overall products distribution. The maximal value of %FE dropped from ≈80 to 68 % at −120 mA cm−2, %FE increased to ≈21 %, however, with not much variation in the %FECO (≈15 to 14 %) (Figure 4 c). Notably, the total liquid products formation was lower for the 10 wt % PTFE‐modified GDE.
The CO2RR product distributions for higher PTFE‐loaded GDEs of 25 and 50 wt % are shown in Figure 4 d,e. A significant declining trend of H2 production had an immense effect on the overall CO2RR products conversion (%FE ‐25 wt %=≈30–45 % and %FE ‐50 wt %=≈25 to 40 %) with %FE increasing to ≈34 (25 wt % PTFE) and 33 % (50 wt % PTFE) at −80 mA cm−2. The total %FE products was ≈54 to 52 % at −80 mA cm−2 for 25 wt % PTFE and 50 wt % PTFE GDEs, respectively (C2+=C2H4, C2H6, C2H5OH, 1‐C3H7OH). Increasing the PTFE loading to 100 and 200 wt % did not further suppress the HER (Figure 4 f,g and S18). CO generation also decreased as compared to 25 and 50 wt % PTFE‐modified GDEs. The C2H4 amount or C2+ products formation also declined further implying an optimal amount of PTFE in the range of 25 to 50 wt % to achieve high C2H4 or C2+ products (Figure 4 h and 5 a). CH4 was detected more at 100 and 200 wt % PTFE‐modified GDEs. ≈3 %FE CH4 was produced with a 200 wt % PTFE‐GDE (Figure S18). Notably, higher PTFE loading substantially reduced the evolving gas bubbles from the GDE surface and gaseous products preferentially diffuse back to the CO2 feed stream (see Scheme S1 of the reactor set up). The formation of high amounts of H2 at higher applied currents is correlated to electrowetting which leads to flooding of the microchannels inside the GDEs and significantly higher electrolyte‐exposed catalyst surface area for the HER.[ 9 , 10 ] The post‐electrochemistry analysis of GDEs with SEM and TEM showed morphological changes (Figure S19–S24). TEM images revealed irregular catalyst particle agglomeration along with the presence of potassium, suggesting partial corrosion of the electrode surface and plausible formation of KHCO3/K2CO3 on the GDE surface. The CO2RR performance of HKUST@400, HKUST@600 is comparable to HKUST@800 in the absence of PTFE (0 wt % PTFE) with a substantial amount of H2 production (Figure S12).
HKUST@1000 was the least active catalyst with respect to C2+ product formation (Figure 5 b,c). As observed for HKUST@800, 25 and 50 wt % PTFE represent the optimal compositions to produce higher CO2RR products over H2, the CO2RR activity of HKUST@400, HKUST@600 and HKUST@1000 were also evaluated with this PTFE amount for comparing to HKUST@800 (Figure 5 b,c and S25–S27). The total C2H4 or C2+ (in %FE) formation reached a maximum for HKUST@800, however with a small difference to HKUST@600, suggesting 600 to 800 °C as the optimal pyrolysis temperature. The octahedral‐shaped microparticles tend to disintegrate, which made the GDE surface rougher and increased the availability of catalytic sites in case of HKUST@400, HKUST@600 and HKUST@800 (Figure S11). In contrast, the microparticles of HKUST@1000 seem to be fused and did not break down completely under sonication (Figure S11). The inferior CO2RR performance of HKUST@1000 could be related to inaccessibility of sufficient CuII active sites. If the intrinsic activity is considered, the large oxygen content in the Cu x O y C z catalysts reduced to mixed‐valence CuI/Cu0 states during the electrochemical reduction, which are supposed to act as active sites for C2+ formation. [28] This was further confirmed from post‐electrocatalysis characterizations of 25 wt % PTFE/HKUST@800‐modified GDE by means of XPS and PXRD.
In PXRD, the crystalline CuO phase (ICDD 00‐048‐1548) in the as‐synthesized HKUST@800 catalyst altered to mixed crystalline phases of Cu0 (ICDD 01‐071‐4611) and CuI 2O (ICDD 01‐078‐5772) (Figure 5 d). The changes of core level Cu 2p3/2 XPS spectra also support predominant conversion to Cu0 and CuI mixed‐oxidation states (Figure 5 e,f).[ 24 , 29 ] Notably, the strong CuIIO signal intensity in the pure HKUST@800 decreased in the deconvoluted XPS spectra of the PTFE‐modified GDE, hinting to reduction of CuO to the mixed valence states CuI/Cu0 during electrocatalysis. Furthermore, the GDE surface becomes rougher during elecrocatalysis with multi‐hollow channels and grain boundaries, and this can create a new hierarchical heterostructure which may not be synthesized directly or be stable under ambient conditions. [30]
Kanan and co‐workers have reported that such in situ formed grain boundaries are highly active sites for C‐C coupling during CO2RR, which could become the determining factor for the selectivity to C2+ products. [28] Yeo and co‐workers have shown that smaller crystallite sizes may generate more grain boundaries, thus increasing the selectivity towards ethylene. [31] Indeed, from the SEM images (Figure S11) it appears that the GDE surface is covered with nanoparticles which may increase the availability of catalytic active sites. However, correlation of the catalytic performances of the catalysts to the quantified carbon (0.07, 0.1, 0.09 and 0.03 wt % for HKUST@400, HKUST@600, HKUST@800 and HKUST@1000, respectively) is not feasible since the CO2RR performance strongly depends on other external factors such as local pH, electrochemical reactor, flow of CO2, electrode preparation etc. along with intrinsic properties of the catalysts.
Determination of the local OH− ion activity
Local changes of ion activities in close proximity to working GDEs surfaces were determined by positioning Pt ultramicroelectrodes (Pt‐UMEs) using shear‐force based SECM approach curves in about 100 nm distance from the GDE surface (see SI, Figure S28–S30).[ 18 , 19 , 20 ] Continuous water consumption during CO2RR as well as HER leads to locally generated OH− ions and induces a pH shift which modulates the CO2RR product selectivity. To evaluate if local pH changes are responsible for the observed change in the CO2RR selectivity, we used this approach to determine local OH− ions activity. We positioned a Pt‐disk nanoelectrode (<1 μm diameter) in close proximity to the PTFE/ HKUST@800‐GDE/electrolyte. The assessment of OH− ions and H2O activities is done by continuous cyclic voltammetry at the Pt‐UME, as the peak potential of the PtO‐reduction peak depends on the OH−/H2O activities according to the corresponding Nernst equation [Eq. 1].
| (1) |
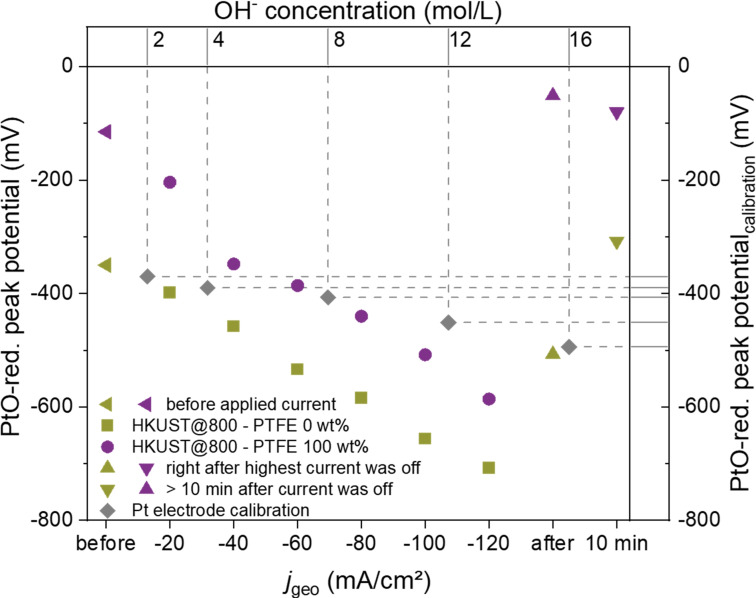
Due to its sensitivity for the local ratio of water to OH− ions activities, both species which are involved in proton‐coupled electron transfer reactions during CO2RR and HER contribute to the activity change in the confined volumes inside the GDE. We applied such measurements to address the question if different properties of the local reaction environment of the catalyst, for example, by modulation of the GDE′s hydrophobicity by PTFE governs product selectivity. HKUST@800‐modified GDEs in the absence and presence of 100 wt % of PTFE were compared as representative samples for low and high PTFE contents that is, low and high hydrophobicity. The PtO‐reduction peak potential for different CO2RR rates at the GDEs shows comparable trends for both samples, namely a negative potential shift with increasing reduction current (Figure 6 and S30) corresponding to a decreasing ratio of H2O/OH− activity due to the higher OH− formation rates with increasing reaction rates of CO2RR and the competing HER. Notably, the peak potentials over the 100 wt % PTFE‐modified GDE exhibited a positive offset with higher relative potential shifts between 0 and −40 mA cm−2 compared to the measurement over the 0 wt % PTFE‐modified GDE. We rationalized this observation with different initial reaction environments due to the absorption of gaseous CO2 from the GDE backside in the 1 M KOH electrolyte at gas/liquid interfaces inside the GDE structure. We confirmed this effect in a control experiment, where the retraction of the Pt‐UME from a “switched‐off” GDE resulted in a negative peak shift illustrated a local depletion of KOH in close proximity to the GDE surface by absorbed CO2 (Figure S31).
Figure 6.
Average PtO‐reduction peak potentials (minimum sample number 10, with a relative error below 2 %) obtained during CV cycles at a Pt‐UME approached to HKUST@800 GDEs with 0 or 100 wt % PTFE modification in 1 M KOH. GDE currents were incrementally increased from 0 to −120 mA cm−2 while continuously recording CVs at the Pt‐UME. After the highest current density, the GDE potential was set to a potential with negligible conversion to follow the time‐dependent equilibration of OH−/H2O activities.
Varying durations of the Pt‐UME approach and thus different exposure times of the electrolyte to CO2, cause a different extent of KOH consumption within the Pt‐tip environment. The resulting lowered alkalinity under zero current conditions allows a more drastic peak potential shift between 0 and −40 mA cm−2 for the 100 wt % PTFE‐modified GDE, considering the logarithmic dependence of E Pt/PtO on the OH− ions activity. For reductive current densities higher than −40 mA cm−2, the relative potential shifts converge for both GDEs, as apparent from the similar slope in the range between −60 and −120 mA cm−2. This trend indicates similar changes in the local OH−/H2O activities with increasing electrochemical turnover which appear to be independent of the PTFE amount in the catalyst layer.
Comparison of the PtO‐reduction peak shifts to the ones obtained in differently concentrated KOH calibration solution (Figure S32–S33) yields information on the extent of local alkalization at different current densities. Despite the differently pronounced effect of local CO2 absorption, both samples cause more negative PtO‐reduction potentials at the Pt‐UME than a 16 M KOH calibration solution.
The fact that such conditions already occur for a current density of −60 and −100 mA cm−2 for 0 and 100 wt % PTFE/HKUST@800‐modified GDEs, respectively, highlights the significant deviation of the local electrolyte composition from the bulk conditions during the high‐current operation of GDEs. Once the GDE is switched back from the highest current density to a potential with negligible conversion, the peak potential shifts back even to be more positive than the starting potential due to the combined effect of OH−‐ions activity equilibration by diffusion and absorption of CO2 into KOH from the gas phase at the backside of the GDE.
Conclusion
HKUST‐MOF derived crystalline Cu x O y C z nanostructures were synthesized and pyrolyzed at varying temperatures and in presence of O2. Surface wettability and GDE flooding were addressed by optimization of the PTFE/catalyst ratio. 25 to 50 wt % PTFE leads to the highest C2+ product formation (%FE =≈54 % at −80 mA cm−2). Since CO2RR and HER contribute equally to the local pH change per transferred electron, the changes in the selectivity patterns due to PTFE addition can be rationalized on the one hand by decreased GDE flooding which leads to a decrease in HER and increased local concentrations of intermediate CO2RR products. A simple scalable catalyst synthesis process and an insight into electrode fabrication aspects coupled with in situ local pH measurements is providing insight with electrowetting process, suppression of the HER and the modulation of CO2RR selectivity.
Conflict of interest
The authors declare no conflict of interest.
Supporting information
As a service to our authors and readers, this journal provides supporting information supplied by the authors. Such materials are peer reviewed and may be re‐organized for online delivery, but are not copy‐edited or typeset. Technical support issues arising from supporting information (other than missing files) should be addressed to the authors.
Supporting Information
Acknowledgements
This project has received funding from the European Research Council (ERC) under the European Union's Horizon 2020 research and innovation programme (CasCat [833408]) as well as from the Deutsche Forschungsgemeinschaft (DFG) in the framework of the research unit FOR 2397e2 (276655237) and under Germany's Excellence Strategy‐EXC 2033‐390677874‐RESOLV. C.A. acknowledges funding by the BMBF in the framework of the NanomatFutur project “MatGasDif” (03XP0263). N.S. acknowledges the Alexander von Humboldt foundation for a Postdoc fellowship. R. Wanka is acknowledged for contact angle measurements, Dr. Ulrich Hagemann from the Interdisciplinary Center for Analytics on the Nanoscale (ICAN), a core facility funded by the DFG (RI 00313) for a part of the XPS measurements and Dr. S. Cychy for adsorption measurements. Open Access funding enabled and organized by Projekt DEAL.
N. Sikdar, J. R. C. Junqueira, S. Dieckhöfer, T. Quast, M. Braun, Y. Song, H. B. Aiyappa, S. Seisel, J. Weidner, D. Öhl, C. Andronescu, W. Schuhmann, Angew. Chem. Int. Ed. 2021, 60, 23427.
References
- 1.
- 1a. Fan L., Xia C., Yang F., Wang J., Wang H., Lu Y., Sci. Adv. 2020, 6, eaay3111; [DOI] [PMC free article] [PubMed] [Google Scholar]
- 1b. Kas R., Yang K., Bohra D., Kortlever R., Burdyny T., Smith W. A., Chem. Sci. 2020, 11, 1738; [DOI] [PMC free article] [PubMed] [Google Scholar]
- 1c. Chen C., Kotyk J. F. K., Sheehan S. W., Chem 2018, 4, 2571; [Google Scholar]
- 1d. Nitopi S., Bertheussen E., Scott S. B., Liu X., Engstfeld A. K., Horch S., Seger B., Stephens I. E. L., Chan K., Hahn C., Nørskov J. K., Jaramillo T. F., Chorkendorff I., Chem. Rev. 2019, 119, 7610; [DOI] [PubMed] [Google Scholar]
- 1e. König M., Vaes J., Klemm E., Pant D., iScience 2019, 19, 135; [DOI] [PMC free article] [PubMed] [Google Scholar]
- 1f. Ross M. B., de Luna P., Li Y., Dinh C.-T., Kim D., Yang P., Sargent E. H., Nat. Catal. 2019, 2, 648. [Google Scholar]
- 2.
- 2a. Zhao J., Xue S., Barber J., Zhou Y., Meng J., Ke X., J. Mater. Chem. A 2020, 8, 4700; [Google Scholar]
- 2b. Zhou Y., Che F., Liu M., Zou C., Liang Z., de Luna P., Yuan H., Li J., Wang Z., Xie H., Li H., Chen P., Bladt E., Quintero-Bermudez R., Sham T.-K., Bals S., Hofkens J., Sinton D., Chen G., Sargent E. H., Nat. Chem. 2018, 10, 974; [DOI] [PubMed] [Google Scholar]
- 2c. Dinh C.-T., Burdyny T., Kibria M. G., Seifitokaldani A., Gabardo C. M., García de Arquer F. P., Kiani A., Edwards J. P., de Luna P., Bushuyev O. S., Zou C., Quintero-Bermudez R., Pang Y., Sinton D., Sargent E. H., Science 2018, 360, 783; [DOI] [PubMed] [Google Scholar]
- 2d. Kuhl K. P., Cave E. R., Abram D. N., Jaramillo T. F., Energy Environ. Sci. 2012, 5, 7050–7059; [Google Scholar]
- 2e. Hori Y., Murata A., Takahashi R., J. Chem. Soc. Faraday Trans. 1 1989, 85, 2309; [Google Scholar]
- 2f. Hori Y., Kikuchi K., Murata A., Suzuki S., Chem. Lett. 1986, 15, 897. [Google Scholar]
- 3. Abdel-Mageed A. M., Rungtaweevoranit B., Parlinska-Wojtan M., Pei X., Yaghi O. M., Behm R. J., J. Am. Chem. Soc. 2019, 141, 5201. [DOI] [PubMed] [Google Scholar]
- 4. Zhao K., Liu Y., Quan X., Chen S., Yu H., ACS Appl. Mater. Interfaces 2017, 9, 5302. [DOI] [PubMed] [Google Scholar]
- 5.
- 5a. Mariano R. G., McKelvey K., White H. S., Kanan M. W., Science 2017, 358, 1187; [DOI] [PubMed] [Google Scholar]
- 5b. Li C. W., Ciston J., Kanan M. W., Nature 2014, 508, 504. [DOI] [PubMed] [Google Scholar]
- 6.
- 6a. Aiyappa H. B., Masa J., Andronescu C., Muhler M., Fischer R. A., Schuhmann W., Small Methods 2019, 3, 1800415; [Google Scholar]
- 6b. Xia W., Mahmood A., Zou R., Xu Q., Energy Environ. Sci. 2015, 8, 1837; [Google Scholar]
- 6c. Wang H.-F., Chen L., Pang H., Kaskel S., Xu Q., Chem. Soc. Rev. 2020, 49, 1414. [DOI] [PubMed] [Google Scholar]
- 7. Zhu Q., Sun X., Yang D., Ma J., Kang X., Zheng L., Zhang J., Wu Z., Han B., Nat. Commun. 2019, 10, 3851. [DOI] [PMC free article] [PubMed] [Google Scholar]
- 8.
- 8a. Mahmood M. N., Masheder D., Harty C. J., J. Appl. Electrochem. 1987, 17, 1159; [Google Scholar]
- 8b. Ma M., Clark E. L., Therkildsen K. T., Dalsgaard S., Chorkendorff I., Seger B., Energy Environ. Sci. 2020, 13, 977. [Google Scholar]
- 9. Burdyny T., Smith W. A., Energy Environ. Sci. 2019, 12, 1442. [Google Scholar]
- 10. Yang K., Kas R., Smith W. A., Burdyny T., ACS Energy Lett. 2021, 6, 33. [DOI] [PMC free article] [PubMed] [Google Scholar]
- 11.
- 11a. Wang Q., Dong H., Yu H., Yu H., J. Power Sources 2015, 279, 1; [Google Scholar]
- 11b. Junge Puring K., Siegmund D., Timm J., Möllenbruck F., Schemme S., Marschall R., Apfel U.-P., Adv. Sustainable Syst. 2020, 2000088; [Google Scholar]
- 11c. Varela A. S., Kroschel M., Reier T., Strasser P., Catal. Today 2016, 260, 8. [Google Scholar]
- 12. Yang K., Kas R., Smith W. A., J. Am. Chem. Soc. 2019, 141, 15891. [DOI] [PMC free article] [PubMed] [Google Scholar]
- 13. Ayemoba O., Cuesta A., ACS Appl. Mater. Interfaces 2017, 9, 27377. [DOI] [PubMed] [Google Scholar]
- 14. Ooka H., Figueiredo M. C., Koper M. T. M., Langmuir 2017, 33, 9307. [DOI] [PMC free article] [PubMed] [Google Scholar]
- 15. Singh M. R., Goodpaster J. D., Weber A. Z., Head-Gordon M., Bell A. T., Proc. Natl. Acad. Sci. USA 2017, 114, E8812–E8821. [DOI] [PMC free article] [PubMed] [Google Scholar]
- 16. Kim B., Ma S., Molly Jhong H.-R., Kenis P. J., Electrochim. Acta 2015, 166, 271. [Google Scholar]
- 17. Gupta N., Gattrell M., MacDougall B., J. Appl. Electrochem. 2006, 36, 161. [Google Scholar]
- 18. Botz A., Clausmeyer J., Öhl D., Tarnev T., Franzen D., Turek T., Schuhmann W., Angew. Chem. Int. Ed. 2018, 57, 12285–12289; [DOI] [PubMed] [Google Scholar]; Angew. Chem. 2018, 130, 12465. [Google Scholar]
- 19. Botz A., Clausmeyer J., Öhl D., Tarnev T., Franzen D., Turek T., Schuhmann W., Angew. Chem. Int. Ed. 2018, 57, 12285; [DOI] [PubMed] [Google Scholar]; Angew. Chem. 2018, 130, 12465. [Google Scholar]
- 20. Dieckhöfer S., Öhl D., Junqueira J. R. C., Quast T., Turek T., Schuhmann W., Chem-Eur. J. 2021, 27, 5906. [DOI] [PMC free article] [PubMed] [Google Scholar]
- 21. Chui S. S.-Y., Lo S. M.-F., Charmant J. P. H., Orpen A. G., Williams I. D., Science 1999, 283, 1148. [DOI] [PubMed] [Google Scholar]
- 22. Xing Z., Hu L., Ripatti D. S., Hu X., Feng X., Nat. Commun. 2021, 12, 136. [DOI] [PMC free article] [PubMed] [Google Scholar]
- 23. Chandra Rath P., Patra J., Saikia D., Mishra M., Chang J.-K., Kao H.-M., J. Mater. Chem. A 2016, 4, 14222. [Google Scholar]
- 24. Biesinger M. C., Surf. Interface Anal. 2017, 49, 1325. [Google Scholar]
- 25. Karimzadeh M., Niknam K., Manouchehri N., Tarokh D., RSC Adv. 2018, 8, 25785. [DOI] [PMC free article] [PubMed] [Google Scholar]
- 26.
- 26a. Bosilj M., Rustam L., Thomann R., Melke J., Fischer A., White R. J., Catal. Sci. Technol. 2020, 10, 4794; [Google Scholar]
- 26b. Jackson C., Smith G. T., Inwood D. W., Leach A. S., Whalley P. S., Callisti M., Polcar T., Russell A. E., Levecque P., Kramer D., Nat. Commun. 2017, 8, 15802; [DOI] [PMC free article] [PubMed] [Google Scholar]
- 26c. Tang H., Cai S., Xie S., Wang Z., Tong Y., Pan M., Lu X., Adv. Sci. 2016, 3, 1500265; [DOI] [PMC free article] [PubMed] [Google Scholar]
- 26d. Yang L., Zeng X., Wang W., Cao D., Adv. Funct. Mater. 2018, 28, 1704537. [Google Scholar]
- 27.
- 27a. Lee S. Y., Jung H., Kim N.-K., Oh H.-S., Min B. K., Hwang Y. J., J. Am. Chem. Soc. 2018, 140, 8681; [DOI] [PubMed] [Google Scholar]
- 27b. Mistry H., Varela A. S., Bonifacio C. S., Zegkinoglou I., Sinev I., Choi Y.-W., Kisslinger K., Stach E. A., Yang J. C., Strasser P., Cuenya B. R., Nat. Commun. 2016, 7, 12123. [DOI] [PMC free article] [PubMed] [Google Scholar]
- 28. Feng X., Jiang K., Fan S., Kanan M. W., ACS Cent. Sci. 2016, 2, 169. [DOI] [PMC free article] [PubMed] [Google Scholar]
- 29. Hayez V., Franquet A., Hubin A., Terryn H., Surf. Interface Anal. 2004, 36, 876–879. [Google Scholar]
- 30.
- 30a. Li C. W., Kanan M. W., J. Am. Chem. Soc. 2012, 134, 7231; [DOI] [PubMed] [Google Scholar]
- 30b. Yang P.-P., Zhang X.-L., Gao F.-Y., Zheng Y.-R., Niu Z.-Z., Yu X., Liu R., Wu Z.-Z., Qin S., Chi L.-P., Duan Y., Ma T., Zheng X.-S., Zhu J.-F., Wang H.-J., Gao M.-R., Yu S.-H., J. Am. Chem. Soc. 2020, 142, 6400. [DOI] [PubMed] [Google Scholar]
- 31. Handoko A. D., Ong C. W., Huang Y., Lee Z. G., Lin L., Panetti G. B., Yeo B. S., J. Phys. Chem. C 2016, 120, 20058. [Google Scholar]
Associated Data
This section collects any data citations, data availability statements, or supplementary materials included in this article.
Supplementary Materials
As a service to our authors and readers, this journal provides supporting information supplied by the authors. Such materials are peer reviewed and may be re‐organized for online delivery, but are not copy‐edited or typeset. Technical support issues arising from supporting information (other than missing files) should be addressed to the authors.
Supporting Information


