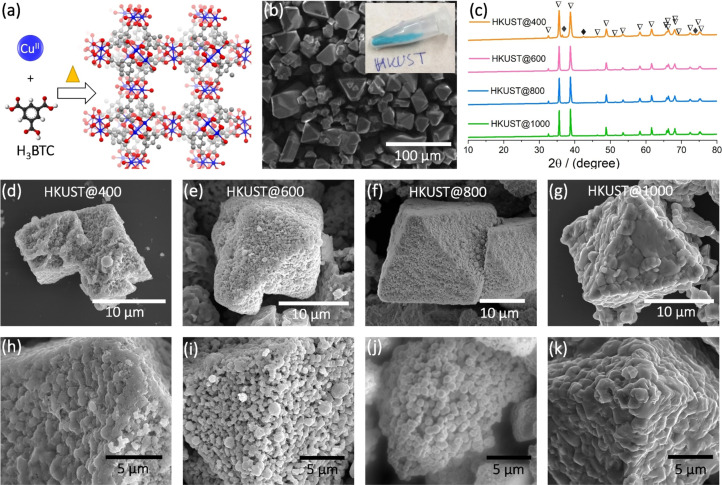
Figure 1.
(a) 3D structural view of Cu‐MOF, HKUST (in ball and stick model, blue: Cu centers, red: O, gray: C, white: H; (b) SEM image of as‐synthesized HKUST crystals; (c) PXRD data of HKUST@400, HKUST@600, HKUST@800 and HKUST@1000, the hollow triangle symbol and filled rhombus symbol represent CuO and Cu2O, respectively; (d–k) SEM images of HKUST@400, HKUST@600, HKUST@800 and HKUST@1000 at different magnifications.

