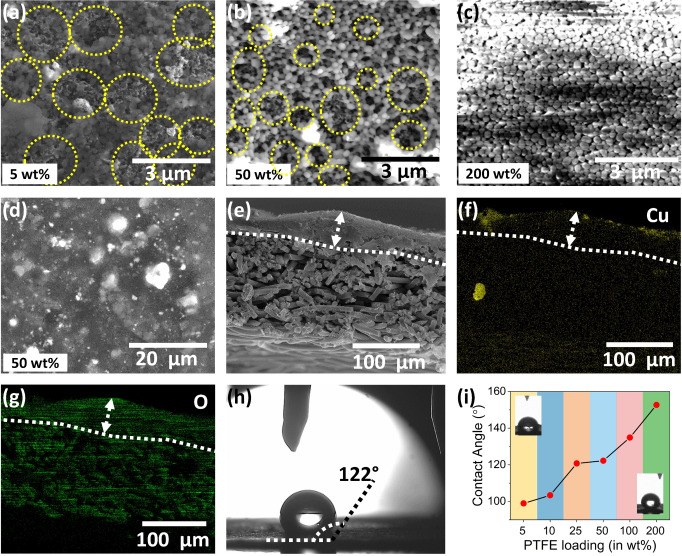
Figure 3.
Images of GDEs with HKUST@800 catalyst: SEM images of (a) 5 wt %, (b and d) 50 wt %, and (c) 200 wt % PTFE‐modified GDE surfaces (the round yellow circles represent PTFE/catalyst heterojunctions); (e) cross section SEM image of 50 wt % PTFE‐modified GDE; (f,g) SEM‐EDS elemental color map showing the distribution of Cu and O; (h) contact angle value determination on the same GDE; (i) plot of contact angle values vs. PTFE loading.

