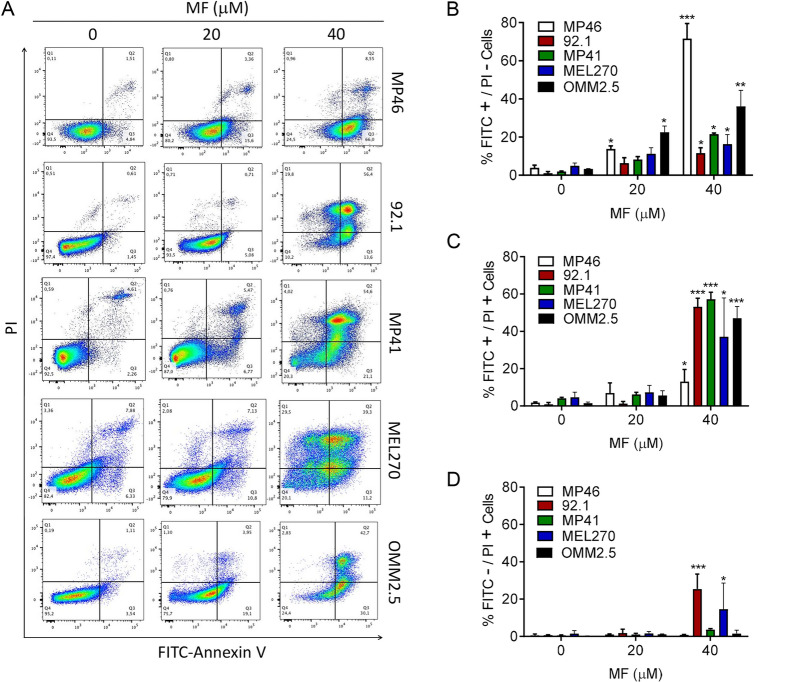
Fig.4.
MF induces apoptosis in UM cells. A Representative histograms depicting the distribution of UM cells exposed to vehicle, 20, or 40 µM MF, and stained with Annexin V-FITC and/or PI after 72 h of incubation. The histograms represent flow cytometry data. B The bar graphs depict the percent of UM cells undergoing early apoptosis as marked by the labeling with only Annexin V-FITC. C Results show the percent of UM cells undergoing late apoptosis represented by cells double labeled with Annexin V-FITC and PI. D The percent of cells likely undergoing necrosis is shown as PI only stained cells. Data were analyzed using two-way ANOVA followed by Dunnett’s multiple comparison test. * Indicates p < 0.05, ** indicates p < 0.01, whereas *** indicates p < 0.001 compared against vehicle-treated controls

