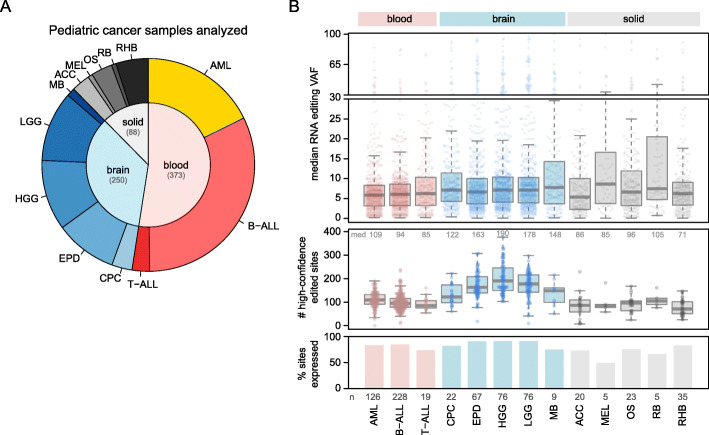
Fig. 2.
Analysis of RNA editing in pediatric cancers. A Pie chart showing the number and type of pediatric cancer samples analyzed, including 711 samples from the PCGP (excluding those showing batch-specific effects in RNA editing VAFs). Samples are divided into blood, brain, and solid (extracranial) cancers and include only diagnosis samples, with one sample per patient. Subtypes of blood, brain, and solid tumors include acute myeloid leukemia (AML), B- and T-acute lymphoblastic leukemia (B-ALL and T-ALL), choroid plexus carcinoma (CPC), ependymoma (EPD), high-grade and low-grade glioma (HGG and LGG), medulloblastoma (MB), adrenocortical carcinoma (ACC), melanoma (MEL), osteosarcoma (OS), retinoblastoma (RB), and rhabdomyosarcoma (RHB). B RNA editing VAFs for each cancer type. The 722 RNA editing sites mentioned in the text were analyzed. Bottom panel y-axis indicates the percentage of the 722 variants in each cancer type that were expressed in at least 3 samples (with 10 reads of coverage), and the numbers at bottom indicate the total number of samples analyzed in each cancer type. The middle panel shows the number of RNA editing sites in each sample (point) that were edited with high confidence (Methods). Median values are shown at the top of the plot. Boxplot shows median (thick center line) and interquartile range (box). Whiskers are described in R boxplot documentation (a 1.5*interquartile range rule is used). In the top panel, the y-axis represents the median RNA VAF, such that each point represents the median RNA VAF for one specific RNA editing site in one specific cancer type. Only positively edited samples were included in the quantification of the median VAF (zero-VAF samples excluded) and only high-confidence editing events were included (Methods). Boxplots median, interquartile range, and whiskers are as in middle panel. Only RNA editing sites for which at least 3 samples in the cancer type had at least 10 reads of RNA-Seq coverage are shown

