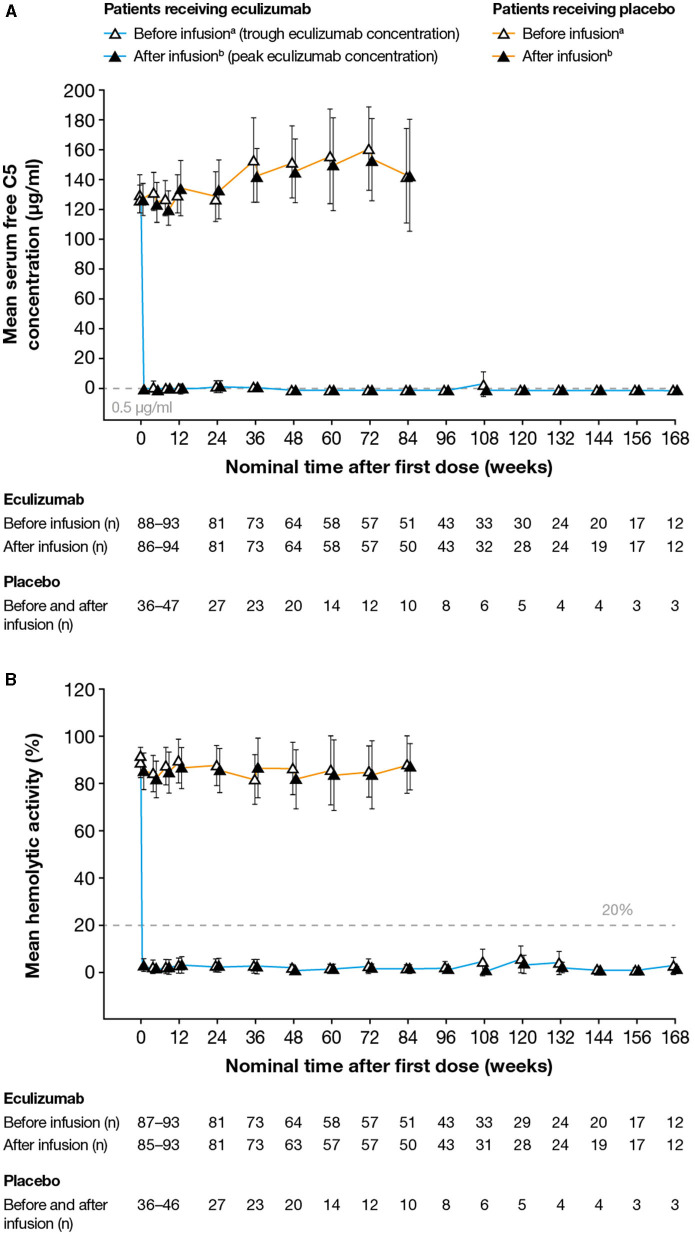
Figure 3.
Serum free C5 concentrations and complement-mediated hemolytic activity in serum during the study. (A) Mean (95% CI) serum free C5 concentrations. Free C5 concentrations below the lower limit of quantification (0.0274 μg/ml) were analyzed as 0.0137 μg/ml (half the lower limit of quantification). Free C5 concentrations below 0.5 μg/ml (dashed line) indicate complete terminal complement inhibition. No free C5 data were available for one patient. (B) Mean (95% CI) percent in vitro complement-mediated hemolytic activity of serum samples. Hemolysis values above 20% (dashed line) indicate incomplete inhibition of hemolysis. No hemolysis data were available for one patient. For both analyses, samples were taken before and after eculizumab infusion (i.e., at eculizumab serum trough and peak concentrations, respectively); samples taken before and after infusion in patients receiving placebo are shown for comparison. C5, complement protein 5; CI, confidence interval. aSamples taken 5–90 min before infusion. bSamples taken 60 min after the completion of infusion. Data are plotted for timepoints when samples were available for ≥ 10 patients. The numbers reported below the graphs are the numbers of patients for whom samples were tested at that timepoint.

