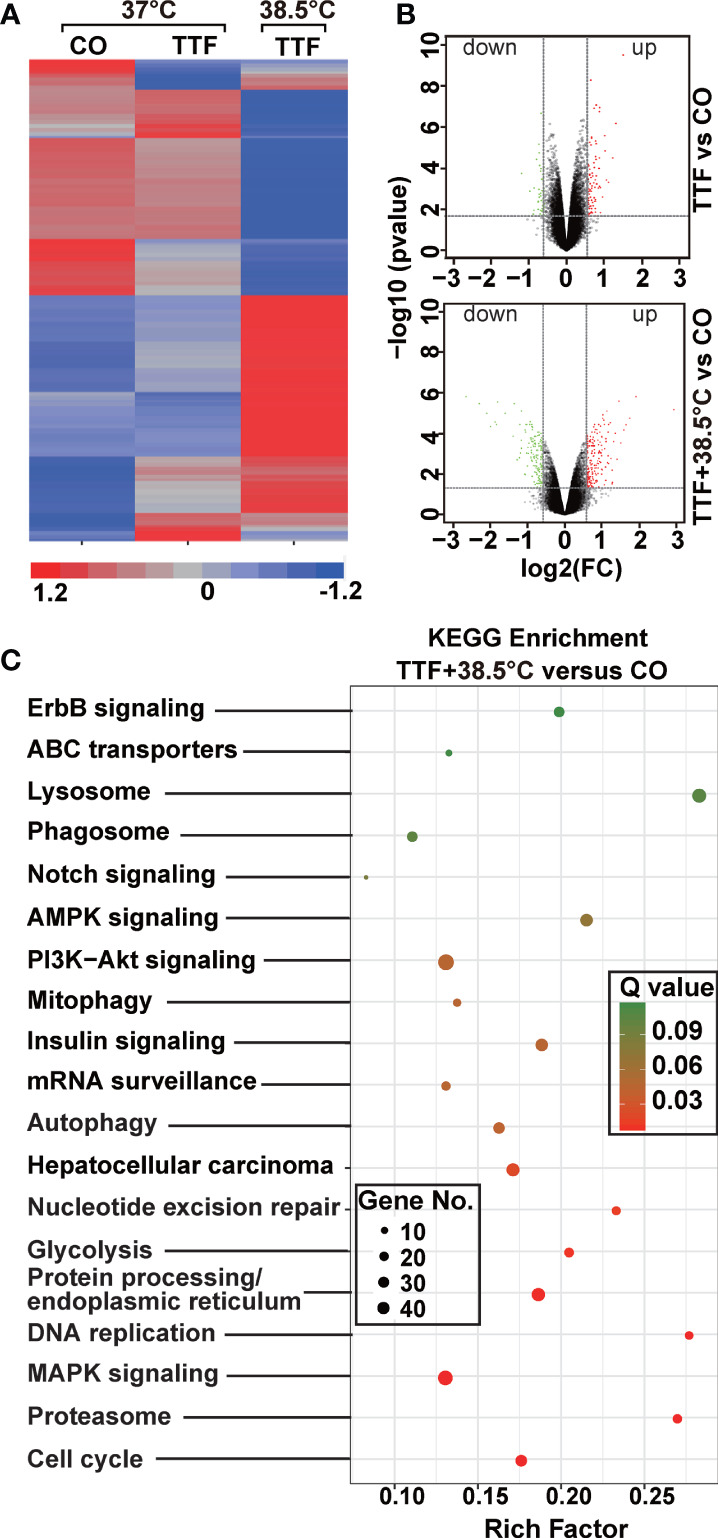
Figure 4.

Gene array analysis demonstrates that hyperthemia enhances TTField-induced differential gene expression. (A) BxGEM cells were cultivated at 37°C in the absence (CO) or presence of TTFields (TTF) or were cultured at 38.5°C in the presence of TTFields (TTF+38.5°C) for 72 hours. Then, the mRNA was isolated, and gene array analysis was performed, followed by analysis of differentially regulated genes with a fold change of at least 1.5 and a significance of P < 0.05. Hierarchical cluster analysis was performed to organize the genes into clusters based on their expression similarities. Red: gene upregulation; Lilac: gene downregulation within a scale of 1.2 to -1.2. (B) Volcano plots were created and show the distribution of differentially expressed mRNAs in BxPc-3 cells cultured at 37°C in the absence (CO) or presence of TTFields (TTF vs CO) or at 38.5°C in the presence of TTFields (TTF+38.5°C vs CO). Red: (upregulated genes); Green (downregulated genes). The X-axis represents the expression profiles of multiple genes. The Y-axis represents the magnitude of gene expression changes. FC = 1.5, P < 0.05. (C) A KEGG enrichment analysis was performed to compare differentially regulated pathways between cells treated with TTFields + 38.5°C and control cells, which were cultivated at 37°C. The X-axis represents the rich factor, and the Y‐axis represents the KEGG terms. Rich factor: ratio of differentially expressed gene numbers annotated in this pathway term to all gene numbers annotated in this pathway term. The greater the Rich factor, the greater the degree of pathway enrichment. The size of the circles increases with the gene count. Different circle colors represent distinct Q values as indicated.
