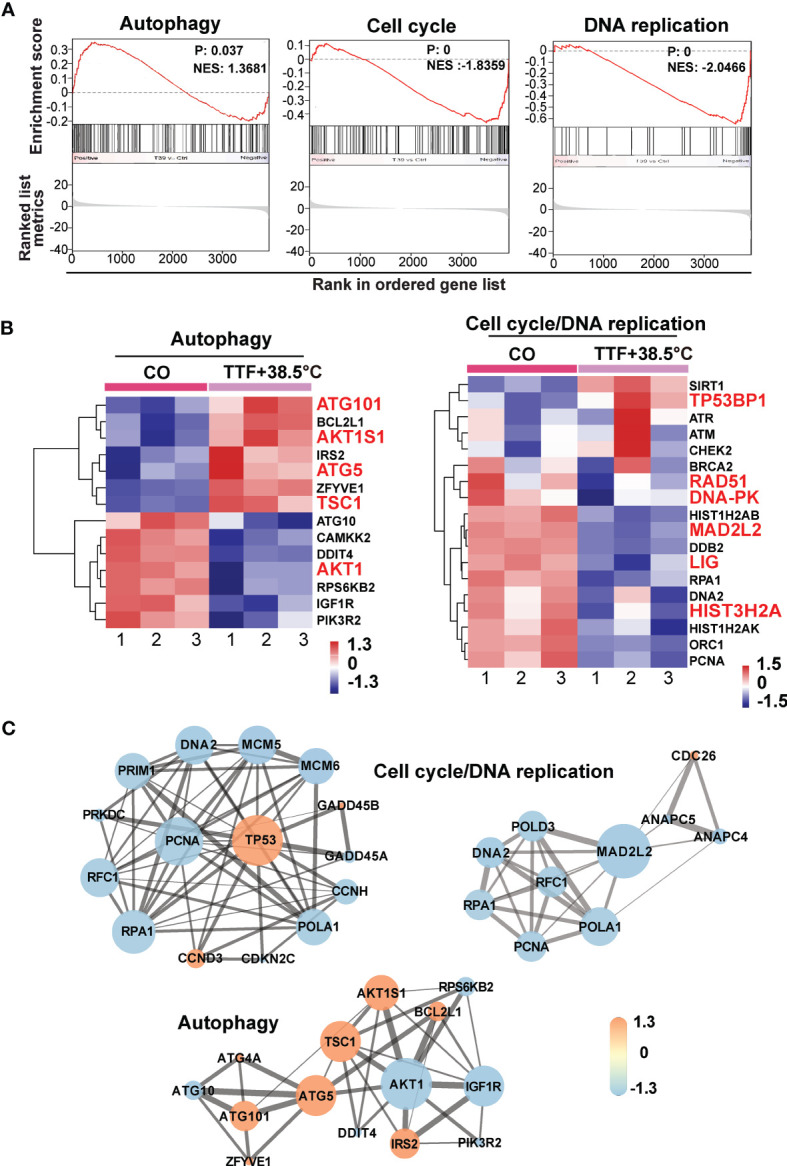
Figure 5.

GSEA suggests TTField plus hyperthermia-mediated regulation of autophagy, the cell cycle and DNA replication. (A) The biological pathways that are enriched in the gene array lists were identified by gene set enrichment analysis (GSEA). Differentially regulated genes in BxGEM cells cultivated at 37°C or at 38.5°C plus TTFields were evaluated. In this way, clustering of an autophagy-related gene set, which positively correlated with the treatment group, was detected (Normalized enrichment score (NES) = 1.3681, P = 0.037, False discovery rate (FDR) = 0.13). Likewise, the clustering of a cell cycle-related gene set was found to be negatively correlated with the treatment group (NES = -1.8359, p = 0, FDR = 0.005). Additionally, the clustering of a DNA replication-related gene set was found to be negatively correlated with the treatment group (NES = -2.0466, P = 0, FDR = 0.006). (B) The most relevant genes of each gene set are shown as heat maps. The name of genes, which were identified by a Cytoscape/String analysis in the following are enlarged and marked in red. (C) The mRNA array data were analyzed with the open source software platform Cytoscape, which resulted in the visualization of networks of co-expressed genes related to the cell cycle, DNA replication and autophagy. The sizes of the circles indicate the interaction degrees of proteins. The circle colors indicate different fold changes. Orange: upregulation, Lilac: downregulation within a scale from -1.3 to 1.3 as indicated.
