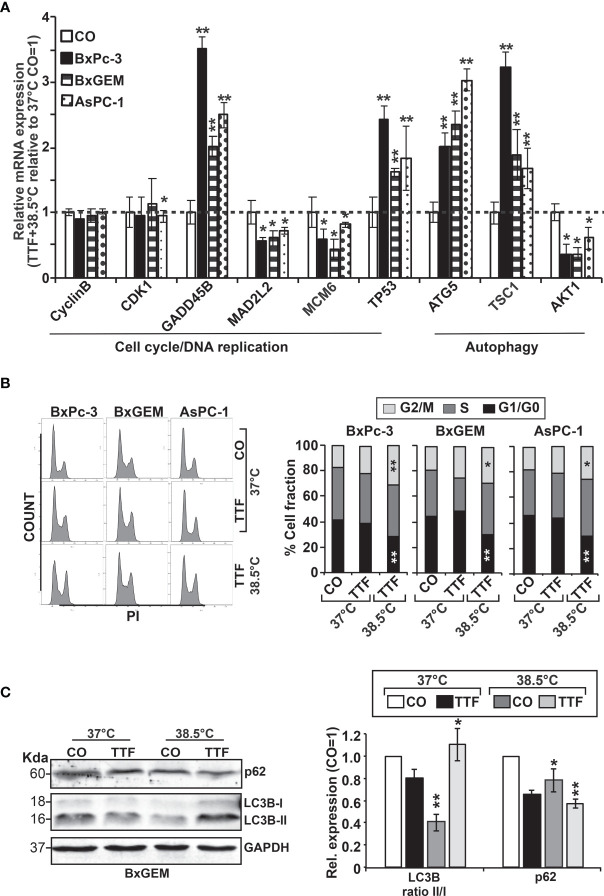
Figure 6.
Functional studies confirm TTField plus hyperthermia-mediated autophagy, the cell cycle and DNA signaling. (A) BxPc-3, BxGEM and AsPC-1 cells were cultivated at 38.5°C plus TTFields or at 37°C in the controls, followed by isolation of mRNA three days later and RT-qPCR analysis. The gene expression level of each gene was normalized to that of GAPDH, and the relative mRNA expression of hyperthermia/TTFields compared to control cells is shown. The primer sequences are given in Supplementary Table S1 , and a comparison of the expression levels is provided in Table 1 . The results are presented as relative gene expression. For calculation, the 2−ΔΔCt method of relative quantification given in the equation was used. (B) PDAC cells were seeded in 96-well plates and cultivated at 37°C in the absence (CO) or presence of TTFields (TTF) or were cultivated at 38.5°C plus TTFields (TTF+38.5°C) for 72 h. Then, the progression of the cell cycle was analyzed by staining the cells with propidium iodide, followed by flow cytometry. The results are shown as flow cytometry profiles (left) and cell cycle quantification in bar graphs (right). (C) The cells were cultivated at 37°C in the absence (CO) or presence of TTFields (TTF) or at 38.5°C plus TTFields, as indicated, and 72 h later, the proteins were isolated, and the expression of p62 and LC3 was examined by the use of specific antibodies and Western blot analysis. GAPDH served as the control for equal conditions. Three independent experiments were performed at least in triplicate, and the data are presented as the means ± SD; *P < 0.05, **P < 0.01.

