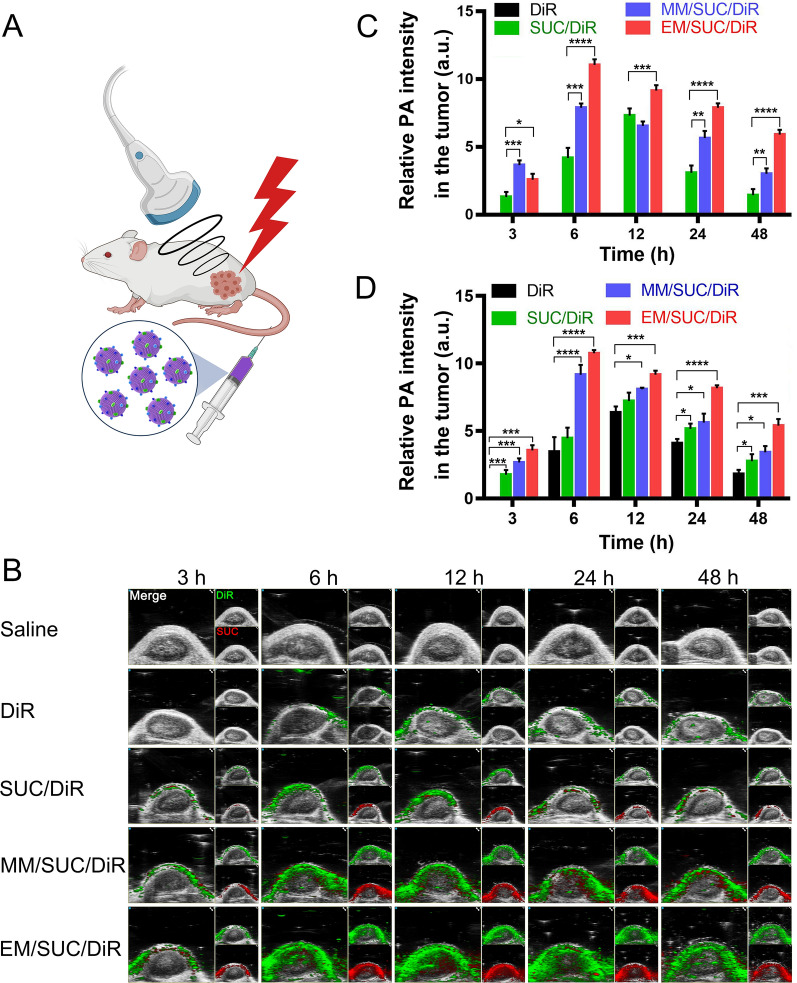
Fig. 4.
PA analysis of artificial exosomes. A Schematic diagram of the administration of SUC-based nanoparticles and the detection of PA signals. B PA analysis of the nanoparticles. C Quantitative analysis of the signals of SUC. D Quantitative analysis of the signals of DiR. EMS were administrated to the mice. PA imaging was used to track the distribution of EMS at different time (3, 6, 12, 24, and 48 h). The quantitative analysis of PA signals was performed with Image J software. The data in C and D are expressed as mean ± SD, n = 3. The statistical significance was calculated via one-way ANOVA with a Tukey post-hoc test. *P < 0.05; **P < 0.01; ***P < 0.001; ****P < 0.0001

