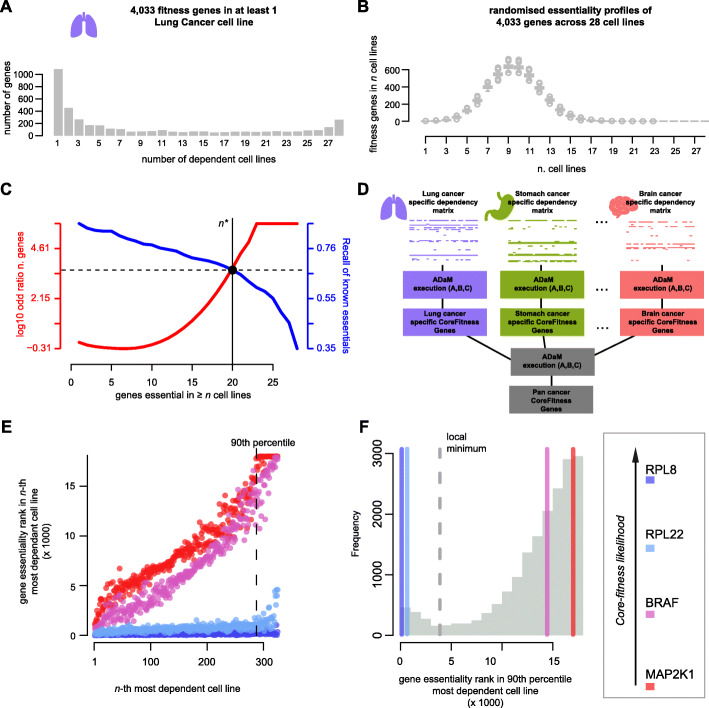
Fig. 1.
Overview of the methods implemented in CoRe. A. Number of fitness genes in fixed numbers of cell lines (CLs) from a lung specific binary cancer dependency matrix (BM). B. As for A but considering 1000 randomisations of the lung BM. C. ADaM execution on the lung BM: The aim is to identify the minimal number n* of CLs in which a gene should be essential to be considered a lung specific core-fitness essential gene (CFG). All possible n values (on the x-axis) are tested. For each n the genes essential in ≥ n CLs are determined. The Recall of a reference set of CFGs (blue curve, and right y-axis) is computed for this set of genes. At the same time the deviance of expectation of the size of this set of genes is also computed (log10 ratio with respect to average value in 1000 permutations of the lung BM - red curve, and left y-axis). The n* value (solid vertical line) is that providing the best trade-off (dashed horizontal line) between the blue and the red curves. D. Schematic of the two-step model of ADaM identifying pan-cancer CFGs. The first determines sets of tissue/cancer-type specific CFGs. The second step computes pan-cancer CFGs as those predicted as tissues/cancer-type specific core-fitness genes for at least t* tissues/cancer-types. This is determined as for the n* in C. E. Basic assumption of the FiPer method: common-essential genes (CEGs) are always among the top essential genes. 4 example genes are shown. Each point indicates a CL. The coordinate on the x-axis indicates the rank position of the CL when sorting all CLs based on their dependency on the gene under consideration, in decreasing order. The coordinate on the y-axis indicates the rank position of the gene under consideration from sorting all screened genes based on their fitness scores observed in the CL under consideration, decreasingly. Common-essential genes (RPL8 and RPL22) ranks always among the top fitness scores, resulting in an almost flat trend. The vertical dashed line indicates the 90th percentile of dependency on the gene under consideration. F. Distribution of all genes’ fitness-rank-positions for the CL at their 90th-percentile of least dependent cell lines, i.e. the dashed vertical line in E). The density of these scores is estimated using a Gaussian kernel and the central point of minimum density is identified. Genes whose score falls below this minimum (i.e. to the left of the gray dashed line) are classified as common-essential by FiPer Fixed

