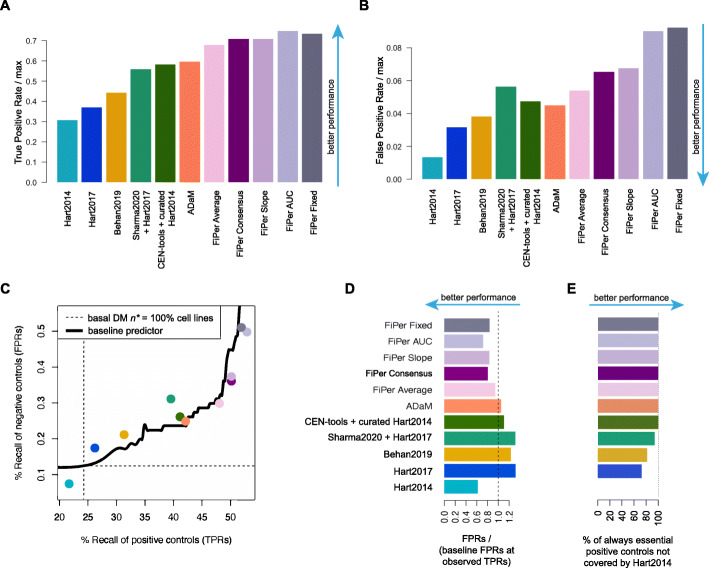
Fig. 4.
Performances of tested methods when accounting for genes in the training sets. AB. True and False positive rates (TPRs, FPRs) of independent true and negative controls across state-of-the-art (SOA) sets of core-fitness essential genes (CFGs), and sets outputted by CoRe and other methods, relative to the maximal TPRs/FPRs attainable by a basal daisy model (DM) predictor of CFGs. C. Performance assessment accounting for set size. Each point corresponds to a different method or SOA set, with coordinates indicating their TPR and FPR, respectively, along the x- and y-axis. The black curve indicates the FPRs obtained by a baseline DM predictor at given TPRs. D. FPRs of all tested methods and SOA sets of CFGs relative to baseline performances. The length of each bar indicates the ratio between the FPR of the set under consideration and that of the baseline DM classifier at a TPR equal to that observed for that set. E. Recall of positive control genes that are essential in 100% of the cell lines in the DepMap dataset and are not covered by the Hart2014 set, across all benchmarked sets

