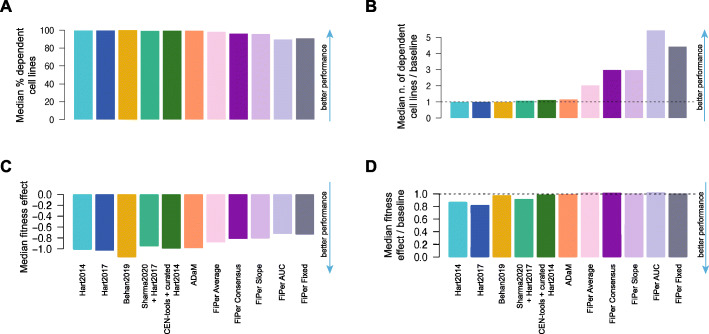
Fig. 5.
Comparison between CFG/CEG sets’ essentiality profile when accounting for genes in the training sets. A. Median percentage of cell lines in which the genes in the predicted sets or core-fitness gene (CFG) or common-essential gene (CEG) sets are significantly essential. B. Ratios between median numbers of dependent cell lines for predicted sets divided by the threshold n of the baseline daisy model predictor (DM) to attain their TPRs. C. Median fitness effect exerted by the genes in the predicted CFG/CEG sets. D. Ratio between the median fitness effect in D and the median fitness effect exerted by the DM at the observed TPRs

