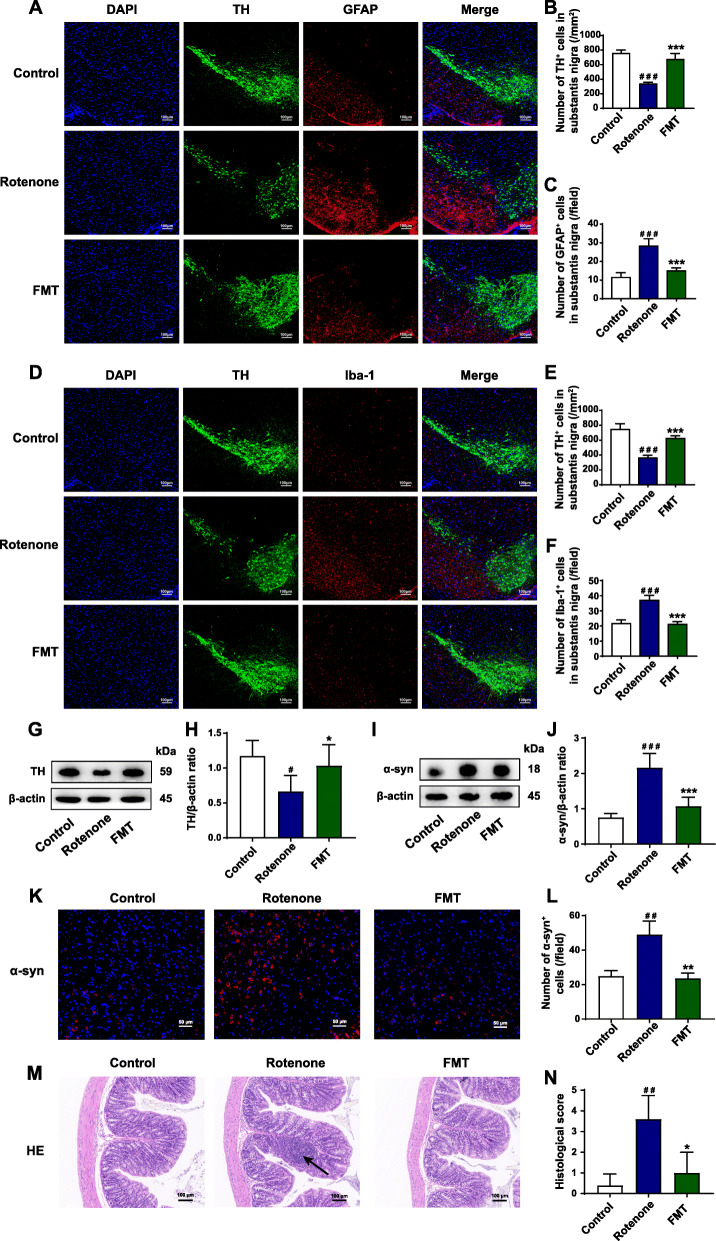
Fig. 2.
FMT administration attenuates PD-associated histological features and inflammation in the SN and the colon of the rotenone-intoxicated mouse model. A Representative captures of immunofluorescence in the SN of nuclei (DAPI, blue), total dopaminergic neurons (TH, green), and astrocytes (GFAP, red). B Numbers of TH+ cells in the SN. C Numbers of GFAP+ cells (activated astrocytes) in the SN. D Representative captures of immunofluorescence in the SN of nuclei (DAPI, blue), total dopaminergic neurons (TH, green), and microglial cells (Iba-1, red). E Numbers of TH+ cells in the SN. F Numbers of Iba-1+ cells (activated microglial cells) in the SN. G Representative western blot brands of TH in the midbrain containing the SN. H The density analysis result of TH western blot in the midbrain containing the SN. I Representative western blot brands of α-syn in the midbrain containing the SN. J The density analysis result of α-syn western blot in the midbrain containing the SN. K Representative captures of immunofluorescence in the SN of α-syn. L Statistical analysis of α-syn density in the SN. M Representative captures of H&E staining in the colon; the black arrow indicates inflammatory infiltration. N Histological scores of colons based on H&E staining. For B and C; E and F; L; and N, n = 5 for each group. For H and J, n = 4 for each group. Data are presented as mean ± SD. #P < 0.05, ##P < 0.01, ###P < 0.001 versus the control group; *P < 0.05, **P < 0.01, ***P < 0.001 versus the rotenone group

