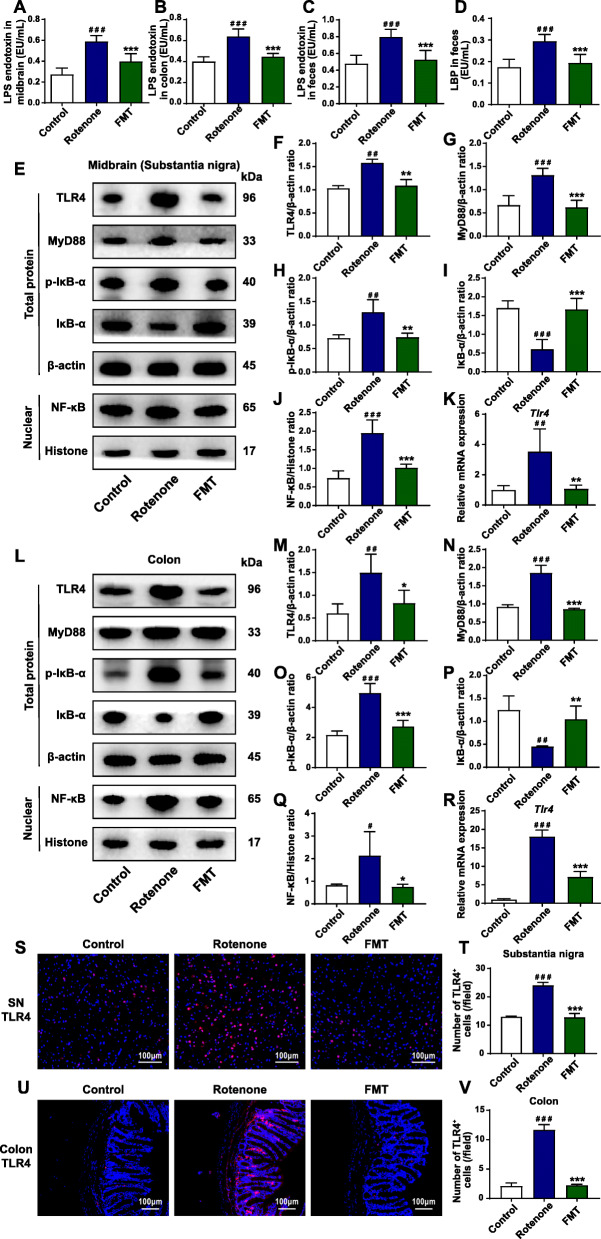
Fig. 4.
FMT administration inhibits the TLR4/MyD88/NF-κB signaling pathway in the SN and the colon of rotenone-induced PD mouse model. A Levels of LPS endotoxin in the midbrain containing the SN. B Levels of LPS endotoxin in the colon. C Fecal levels of LPS endotoxin. D Fecal levels of LBP. E Representative western blot brands of TLR4, MyD88, p-IκB-α, IκB-α, and NF-κB in the midbrain containing the SN. F–J The density analysis results of TLR4, MyD88, p-IκB-α, IκB-α, and NF-κB in the midbrain containing the SN. K mRNA expression of Tlr4 in the midbrain containing the SN. L Representative western blot brands of TLR4, MyD88, p-IκB-α, IκB-α, and NF-κB in the colon. M–Q The density analysis results of TLR4, MyD88, p-IκB-α, IκB-α, and NF-κB in the colon. R mRNA expression of Tlr4 in the colon. S Representative captures of immunofluorescence in the SN of TLR4. T Numbers of TLR4+ cells in the SN. U Representative captures of immunofluorescence in the colon of TLR4. V Numbers of TLR4+ cells in the colon. For A–D, n = 8 for each group. For F–J and M–Q, n = 4 for each group. For K and R, n = 3 for each group. For T and V, n = 5 for each group. Data are presented as mean ± SD. #P < 0.05, ##P < 0.01, ###P < 0.001 versus the control group; *P < 0.05, **P < 0.01, ***P < 0.001 versus the rotenone group

