. 2016 May 23;86(6):1010–1018. doi: 10.2319/122315-881.1

Figure 3.

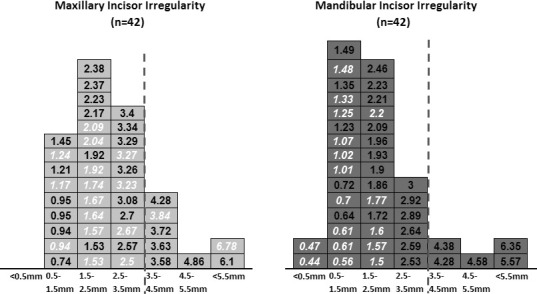
Figure 3. Distribution of incisor irregularity in the maxillary and mandibular arches at recall. Each cell in each histogram represents 1 patient and contains the incisor irregularity. The red vertical line indicates the clinically acceptable range for incisor irregularity (<3.5 mm). Values for patients with a mandibular fixed-retainer are shown in italics with white lettering.

Distribution of incisor irregularity in the maxillary and mandibular arches at recall. Each cell in each histogram represents 1 patient and contains the incisor irregularity. The red vertical line indicates the clinically acceptable range for incisor irregularity (<3.5 mm). Values for patients with a mandibular fixed-retainer are shown in italics with white lettering.