. 2016 May 23;86(6):1010–1018. doi: 10.2319/122315-881.1

Figure 5.

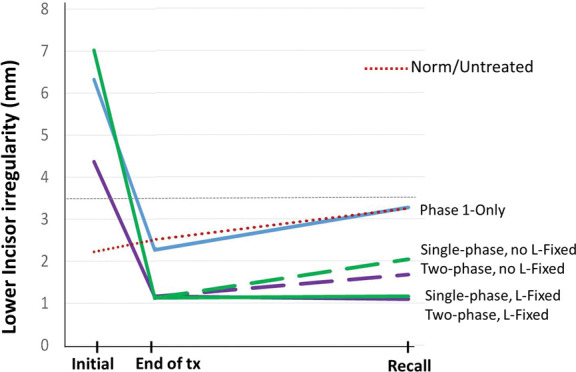
Figure 5. Plots comparing the mean incisor irregularities observed in the three treated groups and age-normed incisor irregularity observed in the untreated subjects. The red dotted line indicates age-normed incisor irregularity regression for the untreated subjects calculated in Figure 4. The horizontal broken line indicates the clinically acceptable incisor irregularity (3.5 mm).1

Plots comparing the mean incisor irregularities observed in the three treated groups and age-normed incisor irregularity observed in the untreated subjects. The red dotted line indicates age-normed incisor irregularity regression for the untreated subjects calculated in Figure 4. The horizontal broken line indicates the clinically acceptable incisor irregularity (3.5 mm).1