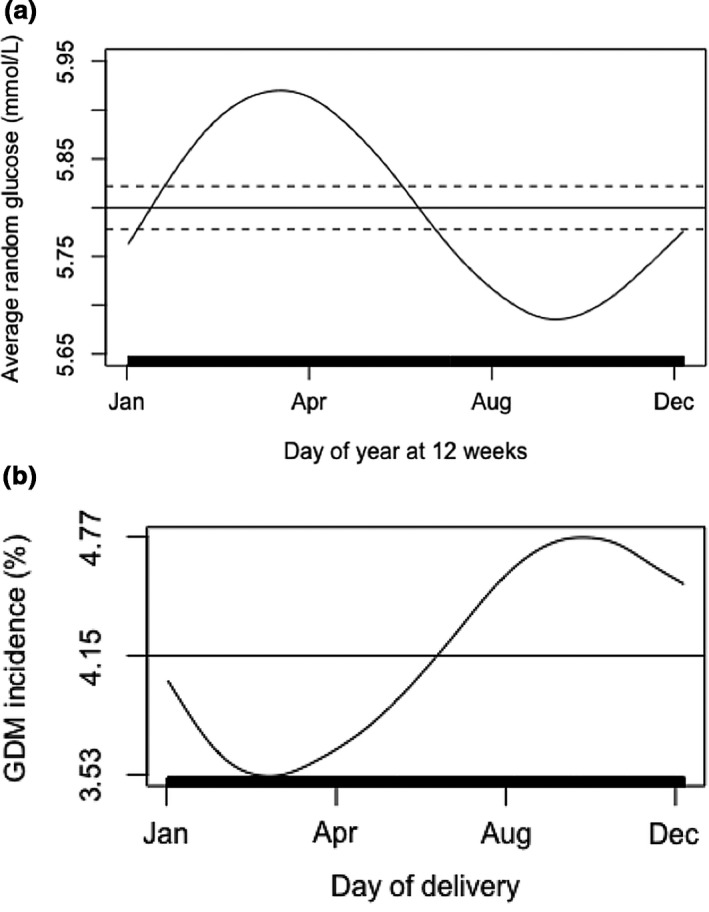
Figure 1.

(a) Result of booking random plasma glucose dependent on day of screening (P<0.001). (b) Risk of diagnosis of gestational diabetes (GDM) dependent on day of delivery (P=0.031). P values refer to the significance of the non‐parametric trend in the relevant dependent variable across the annual cycle, derived from dynamic additive logistic regression models. x‐axis tick marks correspond in dates to 1 January (day 1), 30 April (day 120), 28 August (day 240) and 26 December (day 360), respectively. Vertical marks along the x‐axis represent individual observations. Horizontal line represents the mean risk level for the outcome; risks that are negative with respect to this line are therefore less likely than average, and those that are positive are more likely than average. Dashed lines represent the area within two standard errors of the mean for numeric variables only. Models are adjusted for maternal age, maternal BMI at booking, ethnicity, and parity.
