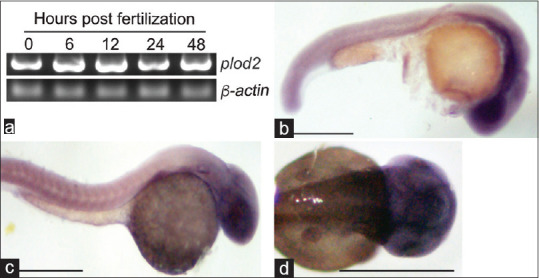
Figure 5.

Expression of plod2 gene during zebrafish embryonic development (a) RT-PCR analysis of the plod2 at various time points post-fertilization. (b and c) Bright-field microscopy lateral view images of zebrafish embryos at 24 hpf (b) and 48 hpf. (c) embryos expressing plod2 gene as revealed by mRNA in situ hybridization. (d) Bright-field microscopy dorsal view image of the 48 hpf zebrafish head region showing plod2 gene expression. Scale bar indicates 1 mm
