
Fig. 5.
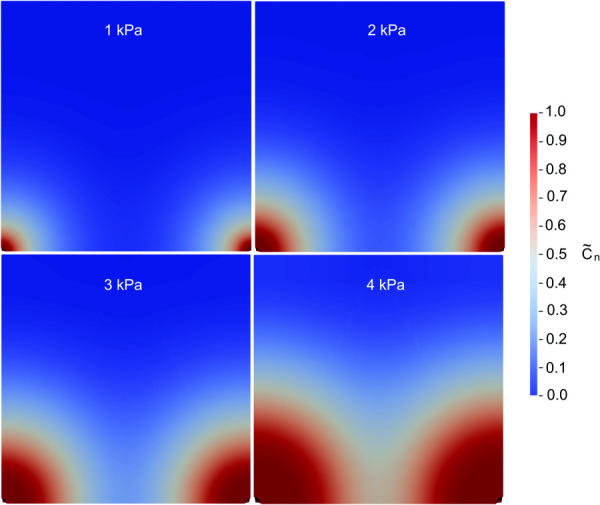
Representative color maps for simulation with source ports (infusion cavities) spaced 1.5 cm apart for infusion pressures ranging from 1 kPa to 4 kPa. The color map shows the normalized effective solute concentration at time = 300 min.
Official websites use .gov
A
.gov website belongs to an official
government organization in the United States.
Secure .gov websites use HTTPS
A lock (
) or https:// means you've safely
connected to the .gov website. Share sensitive
information only on official, secure websites.
Representative color maps for simulation with source ports (infusion cavities) spaced 1.5 cm apart for infusion pressures ranging from 1 kPa to 4 kPa. The color map shows the normalized effective solute concentration at time = 300 min.