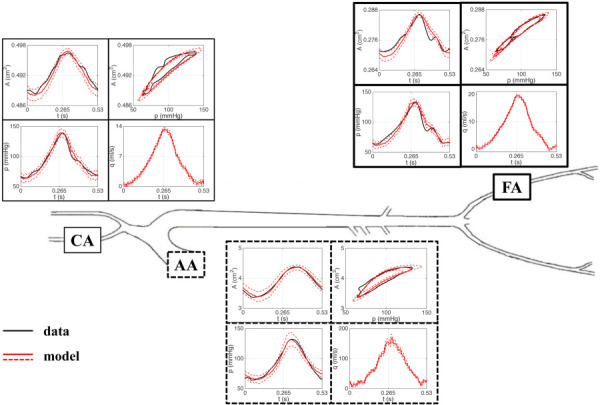
Fig. 5.

Predicted area, pressure, and flow at the center of the vessel obtained using the EnKF estimated inflow profiles and 2 standard deviation curves for single vessels at different locations in the arterial network. Results are shown for (from left to right) the carotid artery (CA), the ascending aorta (AA), and the femoral artery (FA). Corresponding area versus pressure curves obtained using the EnKF estimated inflow profiles are also shown at each vessel location. Area and pressure data are plotted in black.
