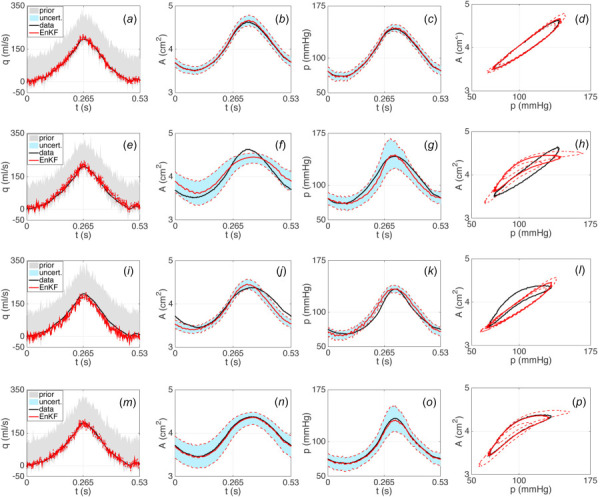
Fig. 6.

Results using the linear Kelvin wall model (first and third rows) and the nonlinear sigmoid wall model (second and fourth rows) with synthetic AA data generated using the Kelvin model (first and second rows) and the sigmoid wall model (third and fourth rows). EnKF estimated inflow profiles (solid red) and 2 standard deviation curves (dashed red) obtained from an initial ensemble of inflow curves (gray cloud) are shown in ((a), (e), (i), (m)). Predicted area and pressure curves using the EnKF estimated inflow profiles and 2 standard deviation curves are shown in ((b), (f), (j), (n)) and ((c), (g), (k), (o)), respectively. Corresponding area versus pressure curves obtained using the EnKF estimated inflow profiles are shown in ((d), (h), (l), (p)). The area between 2 standard deviation uncertainty bounds is shaded in light blue. The true inflow profile and corresponding area and pressure data are plotted in black.
