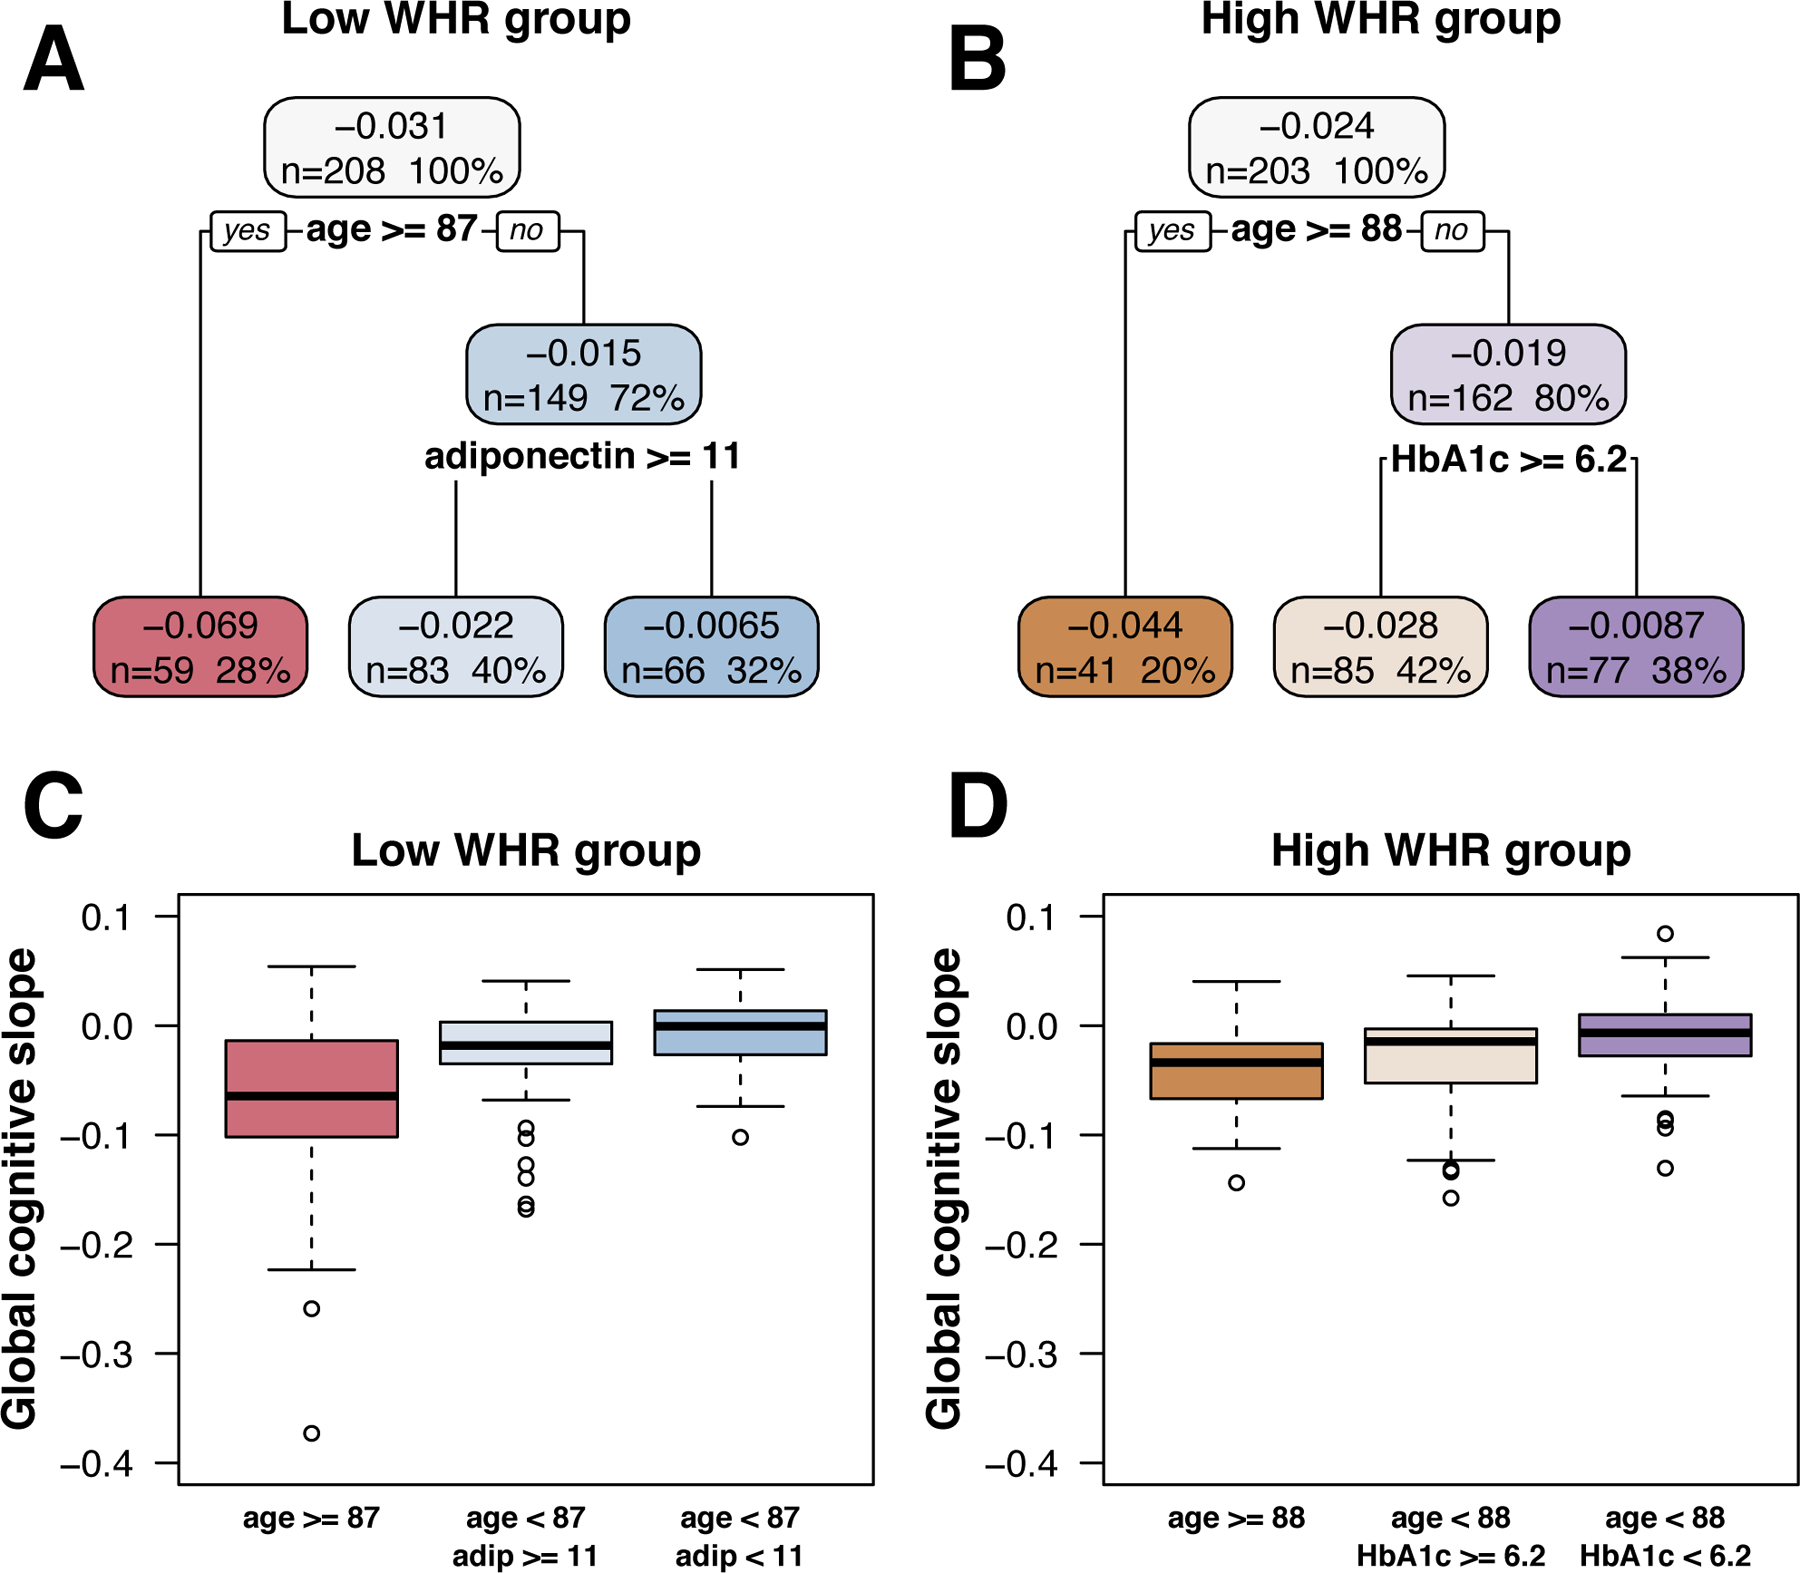
Figure 1. Classification and regression tree (CART) results.

Top row shows the CART models predicting slope of global cognitive decline in (A) low WHR and (B) high WHR groups.
Topmost value in each box represents the mean global cognition slope (change in global composite score per year) for that subgroup, and, below that, the number and percentage of participants in that subgroup.
Boxplots in bottom row show the distributions of observed global cognition slopes in each corresponding CART subgroup for the low WHR (C) and high WHR (D) groups.
WHR: waist:hip ratio, age: age at time of fasting blood draw, adip: adiponectin, hgba1c: hemoglobin A1c.
