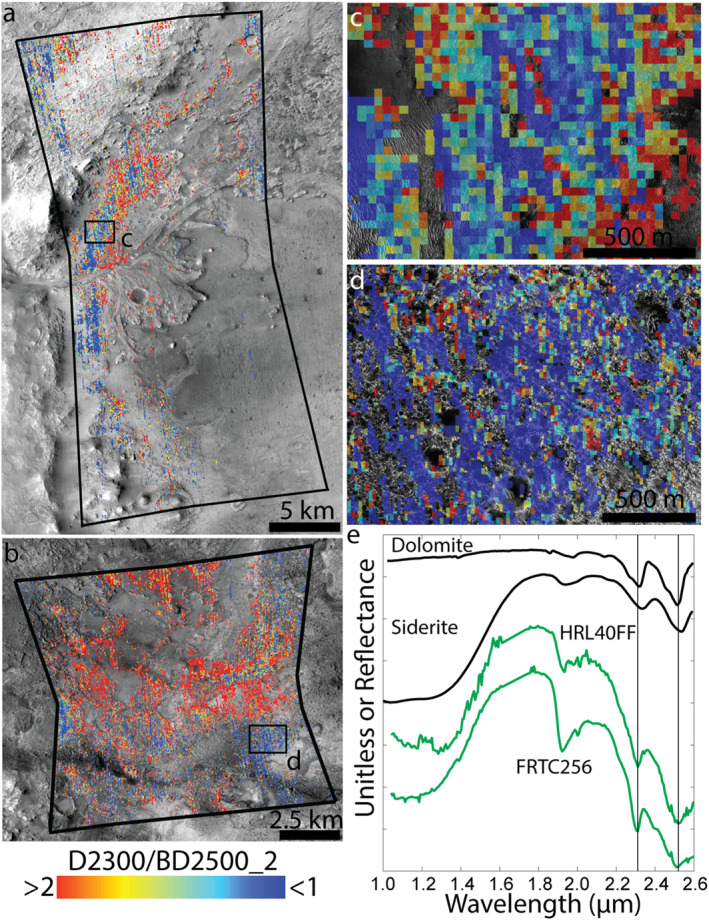
Figure 13.

Comparison of carbonate spectral properties in Jezero crater and elsewhere in the Nili Fossae region. (a) Ratio of the 2.3 and 2.5 μm absorptions (D2300/BD2500_2) in CRISM pixels of image HRL000040FF with BD2500_2 ≥0.005. As noted by Horgan et al. (2020), the most widespread collection of pixels with the lowest 2.3/2.5 μm absorption band depth ratio is associated with the margin fractured unit. However, the 2.3/2.5 μm band depth ratio is also low in the ROB unit immediately outside of Jezero crater. The black outline shows the extent of CRISM image HRL000040FF. (b) Ratio of the 2.3 and 2.5 μm absorptions (D2300/BD2500_2) in CRISM pixels of image FRT0000C256 with BD2500_2 ≥0.005. There are large outcrops of carbonate with similar 2.3/2.5 μm band depth ratios as the margin fractured unit. All pixels shown here are associated with the ROB unit. Figure S14 in Supporting Information S1 shows an expanded view of 2.3/2.5 μm band depth ratios in this region, mosaicing multiple CRISM images. (c) Enlarged view of box shown in panel (a). (d) Enlarged view of box shown in panel (b). (e) Spectral endmembers of pixels shown in panels (a) and (b) calculated via HySime (Bioucas‐Dias & Nascimento, 2008) (green, Section 3.1) compared to library spectra of carbonates (black). Both endmembers are consistent with a mixture of carbonate, Fe/Mg‐phyllosilicate(s), and olivine.
