
Figure 17.
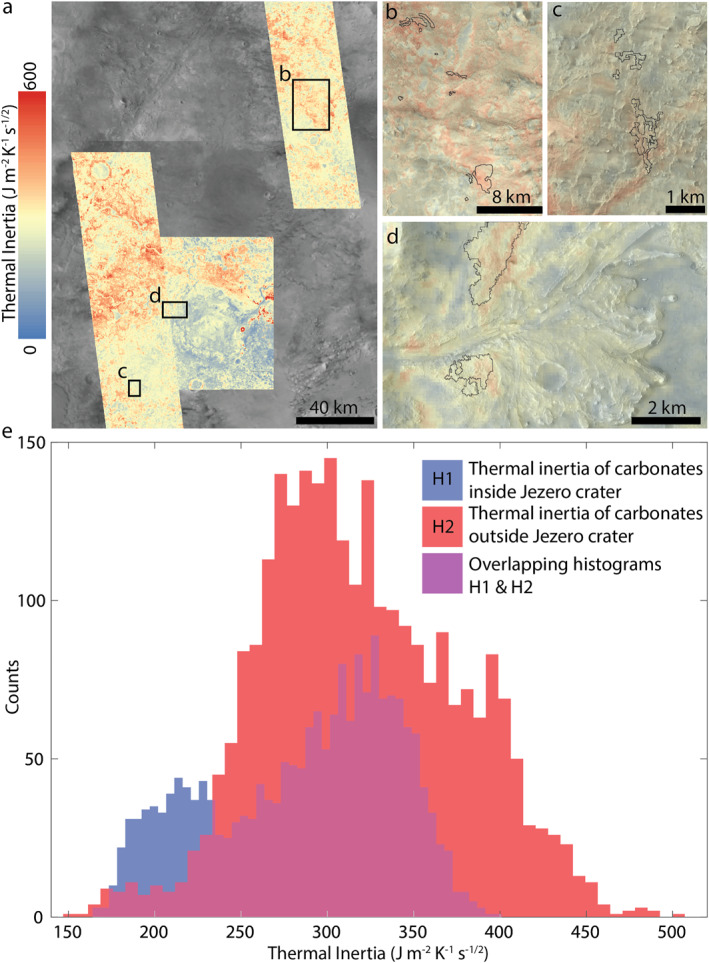
Thermal inertia values for carbonates within and outside of Jezero crater. (a) Overview map of investigated area with THEMIS thermal inertia maps overlain. The scale bar for thermal inertia colors is the same for parts (a)–(d). The thermal inertia map covering Jezero crater is from Edwards and Buz (2021). (b) Enlarged view of the box labeled in panel (a), with the outlines of CRISM pixel clusters from Figure 14 shown in black over the thermal inertia map. These CRISM pixel clusters are from FRT0000C256, FRT000095FE, and FRT000028BA. (c) Same as (b), but for CRISM image FRT00016A73. (d) Same as (b), but for CRISM image HRL000040FF inside of Jezero crater. (e) Histogram of thermal inertia values for all CRISM pixel clusters inside (H1, blue) and outside (H2, red) of Jezero crater shown in Figure 14. The histogram color is purple where the H1 (blue) and H2 (red) histograms overlap. Each histogram has 50 bins. The carbonates in Jezero crater have thermal inertia values within the range of carbonates outside of Jezero crater, but with more low thermal inertia values that are likely associated with dunes and unconsolidated material shown in Figures 4, and 10; Figures S6 and S7 in Supporting Information S1.