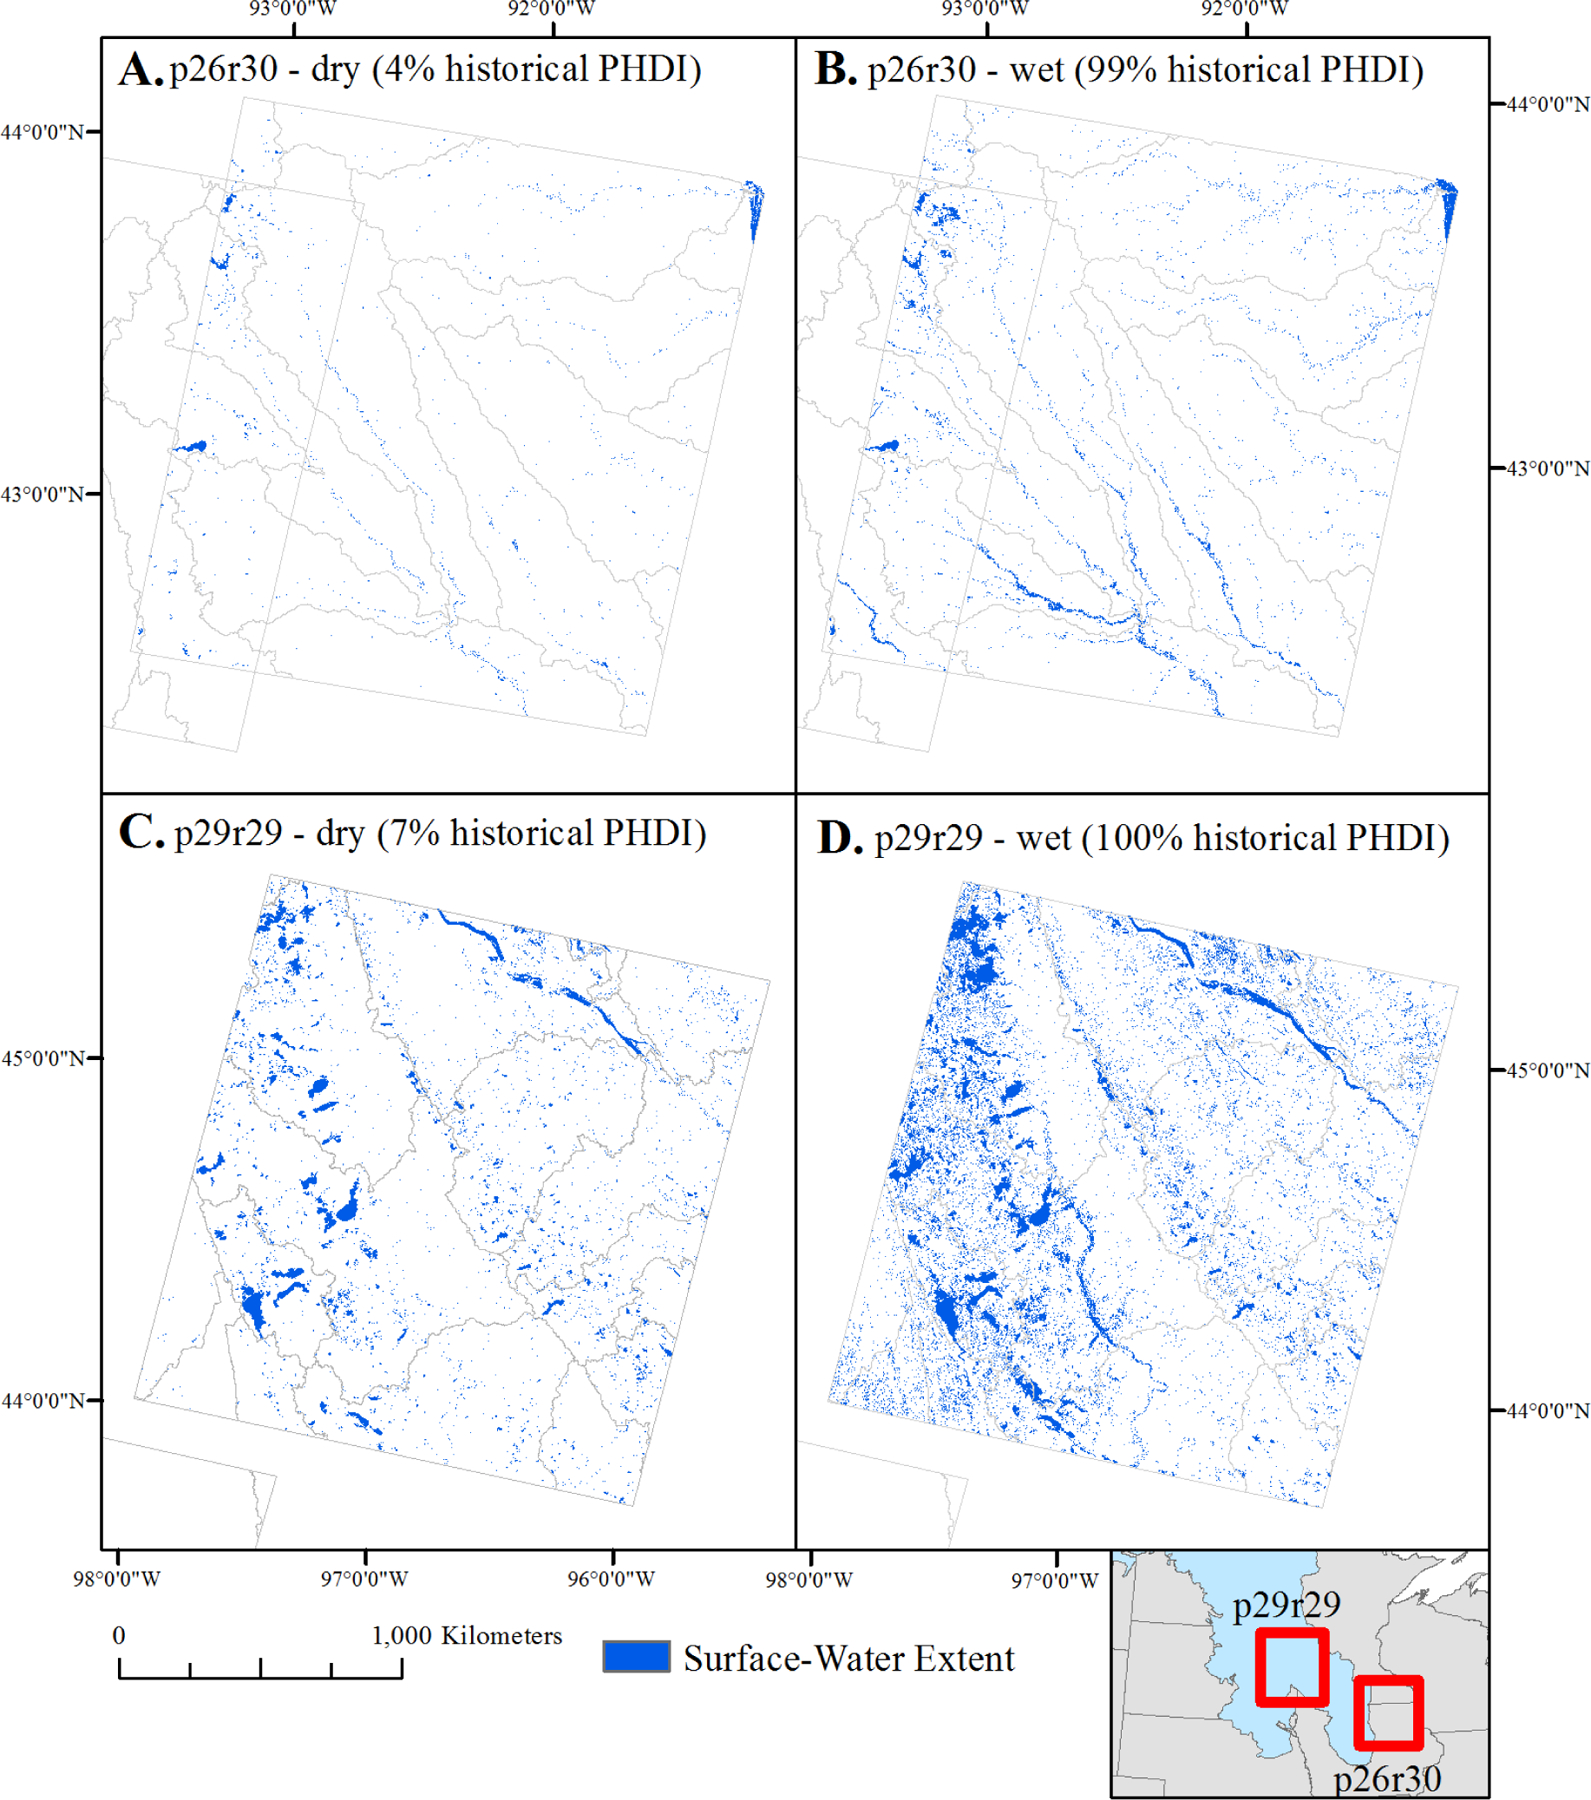
Figure 4.

Mean surface-water abundance and the amount of “wetting up” varied substantially between different Landsat path/rows. Portions of the Northern Prairie (e.g., p26r30) showed relatively less surface-water extent and expansion (A and B) while portions of the Prairie Pothole Region (e.g., p29r29) showed relatively more surface-water extent and expansion (C and D). Note: not all water is visible at this zoomed-out scale. PHDI: Palmer Hydrological Drought Index
