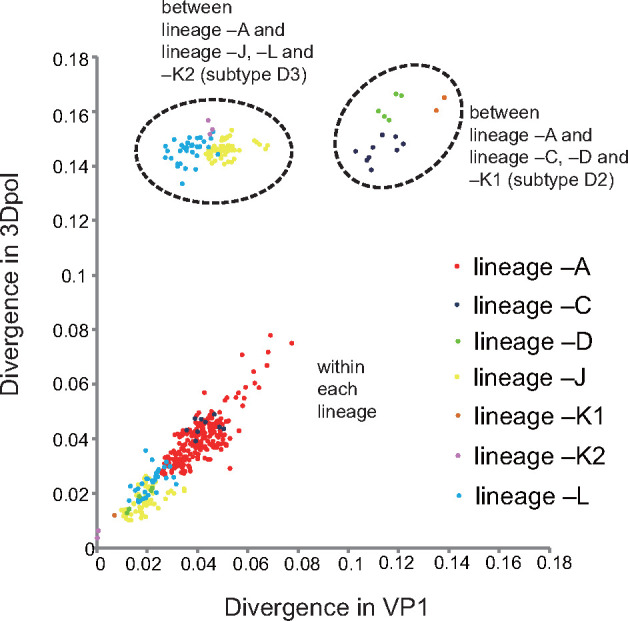
Figure 4.

Comparisons of pairwise distance in P1- and 3Dpol-region sequences within seven lineages; between lineage –A and lineages –J, L, and –K2 (from subtype D3) and between lineage –A and lineages –C,–D, and –K1 (from subtype D2). Axes depict nucleotide divergence between the two genomic regions. Each lineage is indicated by a differently colored dot in the scatterplot.
