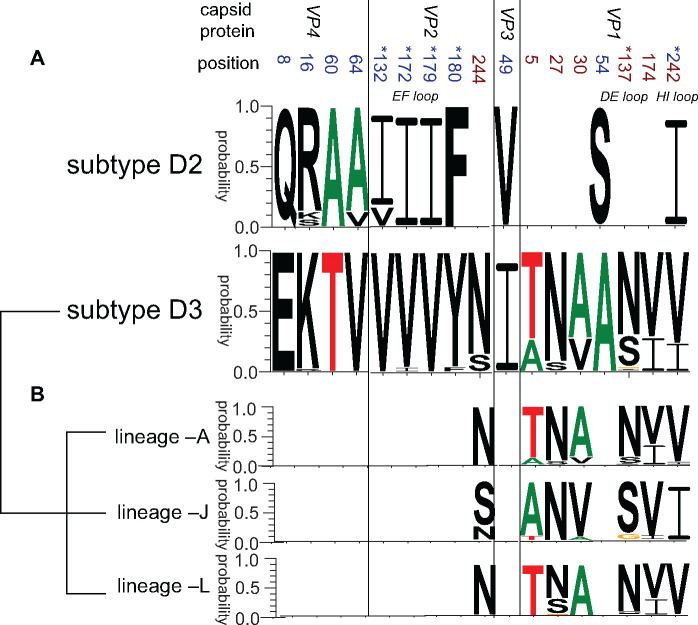
Figure 6.
The aa polymorphisms in the P1 capsid region (A) between subtypes D2 and D3 and (B) among lineages –A, –J, and –L within subtype D3. The positions of aa polymorphisms detected when comparing subtype D3 with subtype D2 are marked in blue, those detected when comparing lineages –A, –J, and –L within subtype D3 are marked in crimson, and position 242 is marked in both colors. The positions of aa polymorphisms that are embedded in the assumed epitope loops are marked with a superscript asterisk. The web-based application WebLogo was used for generating aa sequences logos (Crooks et al. 2004) (http://weblogo.threeplusone.com/).

