Abstract
Changes in left ventricle (LV) shape are observed in patients with pulmonary hypertension (PH). Quantification of ventricular shape could serve as a tool to noninvasively monitor pediatric patients with PH. Decomposing the shape of a ventricle into a series of components and magnitudes will facilitate differentiation of healthy and PH subjects. Parasternal short-axis echo images acquired from 53 pediatric subjects with PH and 53 age and sex-matched normal control subjects underwent speckle tracking using Velocity Vector Imaging (Siemens) to produce a series of x,y coordinates tracing the LV endocardium in each frame. Coordinates were converted to polar format after which the Fourier transform was used to derive shape component magnitudes in each frame. Magnitudes of the first 11 components were normalized to heart size (magnitude/LV length as measured on apical view) and analyzed across a single cardiac cycle. Logistic regression was used to test predictive power of the method. Fourier decomposition produced a series of shape components from short-axis echo views of the LV. Mean values for all 11 components analyzed were significantly different between groups (p < 0.05). The accuracy index of the receiver operator curve was 0.85. Quantification of LV shape can differentiate normal pediatric subjects from those with PH. Shape analysis is a promising method to precisely describe shape changes observed in PH. Differences between groups speak to intraventricular coupling that occurs in right ventricular (RV) overload. Further analysis investigating the correlation of shape to clinical parameters is underway.
Keywords: pulmonary hypertension, echocardiography, ultrasound, imaging, diagnostic testing, remodeling, heart failure
Introduction
Changes in left ventricle (LV) shape (intraventricular septal flattening) secondary to cardiovascular pathology have long been qualitatively observed [1–4]. As pressures in the right and left ventricles deviate from normal, the intraventricular septum begins to shift away from its characteristic circular shape, as viewed in a cross-sectional (short axis) echocardiogram. Shape changes resulting from ventricular pressure imbalances tend to manifest as a characteristic D-shaped LV, change in curvature of the myocardial walls and a loss of circular shape in the LV, leading to an elliptical (eccentric) appearance. Figure 1 depicts severe changes in LV shape as a result of pulmonary hypertension (PH).
Fig. 1.
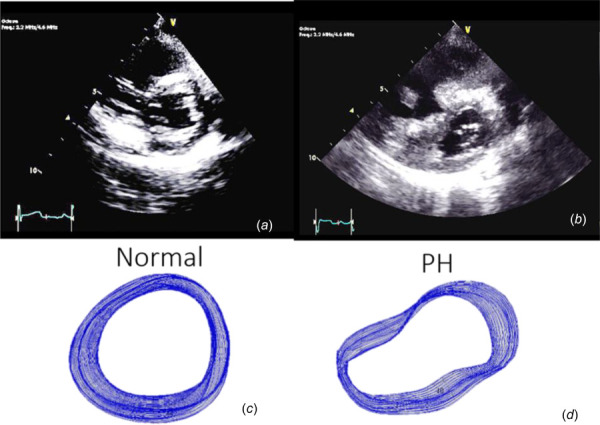
Parasternal short-axis views of the LV in normal (a) subjects and subjects with PH (b) illustrating gross shape deformation in severe PH. Images (c) and (d) show tracings of the endocardial border in all frames acquired over one cardiac cycle. Obvious shape differences are readily perceptible.
Quantitative description of perceptible deviations in left ventricular shape could provide a tool for clinicians to noninvasively enumerate and track disease progression. Several methods for analyzing ventricular shape have been proposed [3–16]. Some methods are very complex and resource intensive, such as three-dimensional ventricular shape analysis [7,8], while others are more rudimentary and accessible, such as eccentricity index [5,12] and ventricular diameter ratios [13]. Some of the simpler methods are very effective for quantifying gross changes while more complex methods can detect very subtle changes more precisely. A need still exists for a technique that lies somewhere in the middle to address limitations of sensitivity and fidelity at one end of spectrum and the practicality and logistics of workflow at the other end. Clinically, image processing techniques must be fast, simple, and not require complex protocols if they are to be adopted for routine use at sites with varying levels human and technological resources. As such, this work focuses on the analysis of ventricular shape using standard two-dimensional echocardiograms and a simple processing algorithm.
Ventricular shape, as viewed in a parasternal short-axis view, can be decomposed into a series of shape components using the Fourier transform. The Fourier transform can take a two-dimensional shape and break it down into a series of component shapes that, when added together, reproduce the original shape. The zeroth-order component corresponds to a pure circular dilation while the first-order shape mode resembles the characteristic D-shape of the LV in the presence of elevated right ventricular (RV) pressures. The second-order shape can be compared to eccentric geometries sometimes quantified using an eccentricity index. The third-order shape is triangular while the fourth-order shape is square. These modes may serve to capture the interfaces between the LV free wall and the septum. The first 5 shape components in the series are shown in Fig. 2. It should be noted that shape component 0 has been added to all subsequent components so the effect of each component's contribution to overall shape can be appreciated.
Fig. 2.
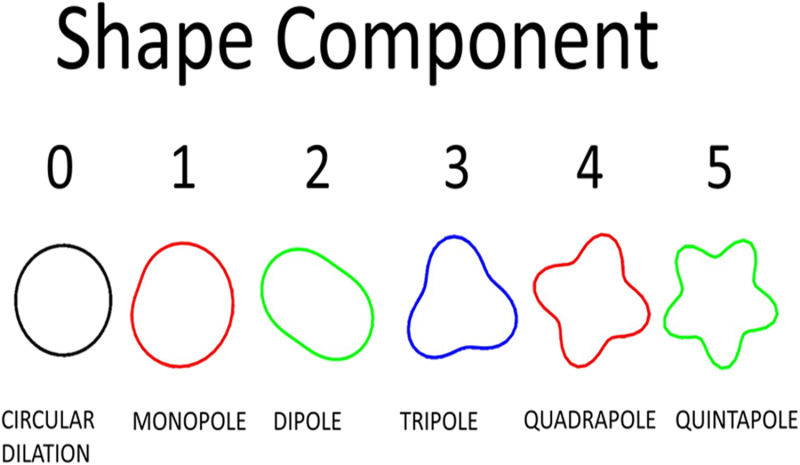
Illustration of first 5 shape components. Mode 0 is associated with pure circular dilation and has been included with the subsequent modes (e.g., mode 3 =mode 0 + mode 3) to emphasize the physical manifestation of each mode on the full shape. Full shapes are achieved by adding all shape components together.
Shape decomposition techniques were first described in 1970 by geologists looking to classify quartz grain patterns [16]. In the early 1980s, clinicians began applying this method to the heart [17–19]. This work provides an efficient, effective, and updated algorithm for implementing the procedure using modern technology.
Methods
Subject Cohort and Imaging Protocol.
The study was approved by the institutional review board of the University of Colorado. A total of 53 age- and sex-matched pediatric subject pairs were analyzed. Healthy controls were compared against a cohort formally diagnosed with PH by experts in the field. Subjects ranged in age from 9 months to 17.1 years with a mean of 7.29±4.45 years. Subjects included diagnoses of both idiopathic PH, and PH associated with congenital heart disease (preoperative or post repair) or secondary to lung pathology. All subjects had normal LV function based on Simpson's monoplane method (ejection fraction >50%).
Any subjects with a secondary cause for septal motion abnormality other than PH including prosthetic valve, pace maker, significant arrhythmia at time of the exam, complex congenital heart disease, or cardiac transplantation were excluded. All subject pairs underwent routine echocardiographic studies. Parasternal short-axis views spanning 1 cardiac cycle were used for shape analysis. Apical four chamber views were used to measure LV length, per American Society of Echocardiography recommendations [20]. Left ventricular length was used to normalize results to heart size as described below.
Image Processing Algorithm.
The endocardial border of the LV was traced in the parasternal short-axis view using vector velocity imaging (Siemens, Erlangen, Germany) to produce a series of 48 x,y coordinate pairs tracing the endocardial border in each frame. The aforementioned Cartesian coordinates were then imported into matlab for processing and analysis. First, the centroid (center of mass) of the LV, in each frame, was calculated. Coordinates (x,y) of the centroid, in each frame, were averaged to produce a global centroid across all image frames acquired during the cardiac cycle. Using the global centroid, coordinates defining the endocardial border were converted from Cartesian to polar systems, where, the inverse tangent, accounting for the quadrant of the unit circle in which the original point was located, was used to calculate an angle (θ) and the Pythagorean theorem was used to calculate a radius (r) per below equations:
| (1) |
where the resultant angle is located within the quadrant of the x,y coordinates with respect to a unit circle
| (2) |
where x and y are coordinates describing the endocardial border, and r is the resultant radius when converted to polar coordinates centered on the global centroid of the left ventricular shape.
To prepare for the Fourier transformation, a cubic spline was fit to the endocardial tracing. Forty eight equally spaced points, lying on the spline, were then calculated. The 48 points defining the spline that was fit to the LV endocardial border were then analyzed using a discrete Fourier transform, per the equation below, in matlab:
| (3) |
where vectors X and Y are of length n which, in this case, is 48. The Fourier transform produced magnitude and phase information for a series of 48 shape components. All shape component magnitudes were then normalized by LV length. A flowchart for the process is provided in Fig. 3.
Fig. 3.
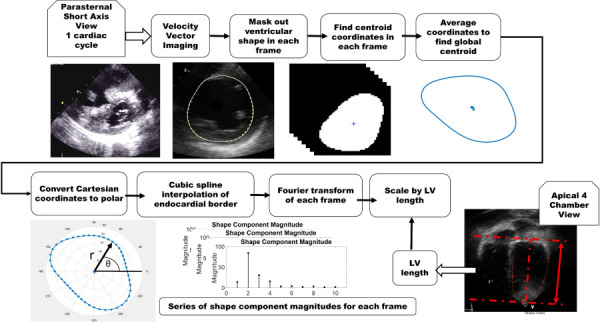
Image processing algorithm for extraction of shape information. The apical four chamber view image depicts how measurements of the left ventricular length were obtained and used to normalize shape distributions to heart size.
Analysis and Modeling.
The first 11 (of 48) shapes were analyzed for significance. A limited number (11) of shape components were chosen due to correlations between low and higher order shape modes to prevent collinearity within the multivariate logistic regression. Shape mode magnitudes were taken in systole and diastole. Additionally, maximum and minimum component magnitudes across the entire cardiac cycle were analyzed. All magnitudes were normalized to heart size using left ventricular length as measured in an apical four chamber view. Magnitudes were compared using paired t-tests to assess differences between group means for the first 11 shape components. Next, magnitudes were assessed for collinearity, after which a multivariate logistic regression was performed by calculating a generalized linear model fitting predictor variables (shape component magnitudes) to a binary response (diagnosis of PH or not). This process can be described by the following equation:
| (4) |
where Y is a binary response (PH or no PH), X is a set of predictor variables, and β is a set of coefficients that relate the response to the predictor variables. For a binary response variable, a logistic regression may be employed to calculate the probability that a given set of predictor variables will fall into one class or the other. This form of a generalized linear model is described in the following equation:
| (5) |
where X is a vector of predictor variables that may be continuous, or discrete, β is the coefficient vector describing the regression model, and p is the probability that the sample belongs to a particular response group (normal versus PH).
Generalized linear models (logistic regressions) were then optimized for the minimum number of predictor variables (shape components) and used as classifiers to produce receiver–operator characteristic (ROC) curves for prediction of a PH diagnosis. When building an ROC curve, known classifications, in this case a PH diagnosis, are compared to probabilities calculated by the logistic regression. Differences between the calculated and actual classifications are quantified as true and false detection rates on scales from 0 to 1. When plotted against one another, the true and false positive rates capture the efficacy of the diagnostic test. A perfect diagnostic would produce an area of 1 under the curve, indicating that all diagnoses were made with false positive/negative rates equal to 0.
Correlations between tricuspid regurgitation jet (TR) velocity and shape component magnitude were also investigated. After analyzing the full cohort, the analysis was repeated to assess the utility of the technique for detecting early stage disease. To do this, subjects with TR velocities < 3.6 m/s were assumed to be in earlier stages of the disease. TR jet velocities are considered normal when less than 2.5 m/s [12] but 3.6 m/s was used in this study due to limited sample size. While this condition (TR jet velocity < 3.6 m/s) is likely true for all control subjects, it was hypothesized that analysis of shape components could still distinguish between the control and PH cohorts. The analysis was repeated in 17 subject pairs. Subjects diagnosed with PH, and having measured TR velocities ranging from 1.72 to 3.55 m/s (mean of 3.06±0.50 m/s), were compared against age/sex matched controls. The cohort described here will subsequently be referred to as the low TR velocity cohort.
Results
Significant differences were observed between healthy and hypertensive groups. This section provides t-test comparisons of shape component magnitudes followed by a series of logistic regression models and finally a description of correlations between TR velocity and shape component magnitude.
Shape Distributions.
In the hypertensive group, shape component distributions tend to shift away from pure circular dilation with increasing contributions from higher order shapes. Shape distributions are visibly different between cohorts as shown in Fig. 4.
Fig. 4.
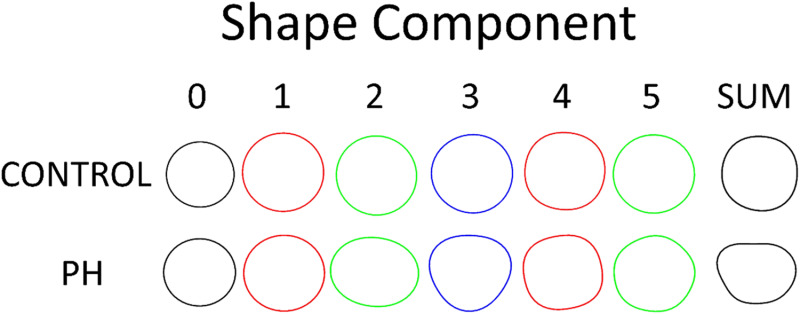
Shape components from age/sex matched pair. Analysis performed on systolic frame. Left ventricular shapes reconstructed from all 48 components are also shown to depict actual ventricular shape.
The first 11 components were analyzed in systole, diastole, and across one cardiac cycle using a two tailed, paired t-test. When examining the full subject cohort (53 subjects), seven of the first 11 shape component magnitudes were significantly different at a small significance threshold (p < 0.0001). Eight shape component magnitudes in the low TR velocity cohort were significantly different using a larger significance threshold (p < 0.05). Results from t-tests are summarized in Table 1. Figure 5 illustrates shape component distributions.
Table 1.
Comparison of shape component magnitudes in systole, diastole, and looking at global minima and maxima across one cardiac cycle
| Shape component | |||||||||||
|---|---|---|---|---|---|---|---|---|---|---|---|
| Frame | 0 | 1 | 2 | 3 | 4 | 5 | 6 | 7 | 8 | 9 | 10 |
| P values for shape component magnitude comparisons | |||||||||||
| Control versus PH | |||||||||||
| Systole | 6.93 × 10⁻³ | 1.41 × 10⁻³ | 1.53 × 10⁻⁵a | 5.97 × 10⁻⁷a | 2.47 × 10⁻⁴ | 3.60 × 10⁻⁵a | 7.72 × 10⁻⁶a | 1.75 × 10⁻⁵a | 1.30 × 10⁻⁴ | 8.32 × 10⁻⁵a | 5.39 × 10⁻⁵a |
| Minimum across cycle | 6.93 × 10⁻³ | 1.63 × 10⁻¹ | 5.42 × 10⁻⁵a | 2.26 × 10⁻⁵a | 7.86 × 10⁻⁴ | 2.57 × 10⁻² | 1.71 × 10⁻³ | 1.57 × 10⁻⁴ | 3.61 × 10⁻² | 5.21 × 10⁻⁴ | 1.57 × 10⁻³ |
| Diastole | 1.88 × 10⁻³ | 3.39 × 10⁻¹ | 3.73 × 10⁻⁴ | 1.89 × 10⁻⁴ | 3.16 × 10⁻⁴ | 5.74 × 10⁻³ | 1.17 × 10⁻³ | 1.26 × 10⁻⁴ | 3.62 × 10⁻² | 9.95 × 10⁻⁵a | 1.08 × 10⁻² |
| Maximum across cycle | 1.88 × 10⁻³ | 9.61 × 10⁻³ | 2.86 × 10⁻⁵a | 8.52 × 10⁻⁷a | 2.10 × 10⁻⁴ | 4.63 × 10⁻⁵a | 1.16 × 10⁻⁵a | 3.88 × 10⁻⁶a | 1.48 × 10⁻⁴ | 1.75 × 10⁻⁵a | 4.64 × 10⁻⁵a |
| P values for shape component magnitude comparisons | |||||||||||
| TR velocity < 3.6 m/s | |||||||||||
| Control versus PH | |||||||||||
| Systole | 3.52 × 10⁻²b | 1.25 × 10⁻¹ | 1.17 × 10⁻²b | 4.10 × 10⁻²b | 2.29 × 10⁻²b | 1.66 × 10⁻²b | 5.91 × 10⁻² | 2.17 × 10⁻²b | 1.99 × 10⁻¹ | 1.01 × 10⁻¹ | 2.62 × 10⁻²b |
| Minimum across cycle | 3.52 × 10⁻²b | 9.85 × 10⁻¹ | 3.78 × 10⁻²b | 4.74 × 10⁻²b | 2.60 × 10⁻²b | 1.99 × 10⁻¹ | 4.98 × 10⁻¹ | 1.01 × 10⁻¹ | 2.38 × 10⁻¹ | 1.81 × 10⁻²b | 1.68 × 10⁻¹ |
| Diastole | 5.44 × 10⁻² | 6.09 × 10⁻¹ | 1.60 × 10⁻¹ | 1.72 × 10⁻¹ | 1.78 × 10⁻²b | 2.82 × 10⁻¹ | 3.14 × 10⁻¹ | 1.43 × 10⁻¹ | 2.65 × 10⁻¹ | 2.91 × 10⁻²b | 6.62 × 10⁻¹ |
| Maximum across cycle | 6.44 × 10⁻¹ | 3.46 × 10⁻¹ | 5.13 × 10⁻² | 5.14 × 10⁻² | 8.95 × 10⁻² | 9.01 × 10⁻² | 9.76 × 10⁻² | 4.00 × 10⁻²b | 9.56 × 10⁻² | 3.55 × 10⁻²b | 4.47 × 10⁻²b |
p values < 0.0001 using a two tailed, paired t-test. Low TR velocity cohort includes only age/sex matched pairs with a TR velocity less than 3.60 m/s (17 subject pairs).
p values < 0.05 using a two tailed, paired t-test.
Fig. 5.
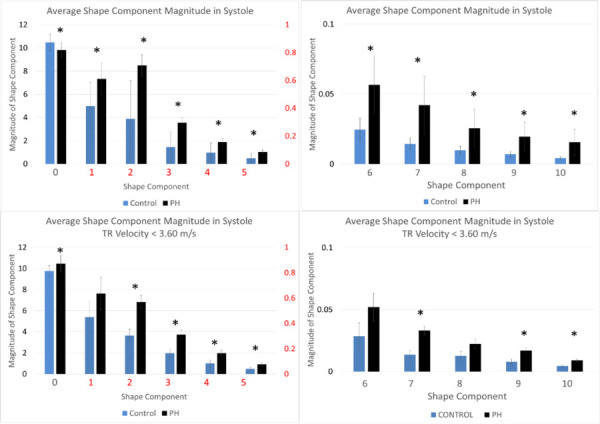
Shape component distribution in both subject cohorts. Asterisks indicate a significant difference in mean values between control and PH groups at a significance level of p < 0.05.
Differences between the full cohort and low TR velocity cohort are most noticeable in the modes corresponding to pure circular dilation along with the D and elliptical shape modes. There appears to be a more linear shift in shape distribution in the early stage cohort while the full cohort displays some variance in how the shape modes are distributed. To illustrate the sensitivity of this method to subtle shape variations, Fig. 6 compares a control subjects tracings and component magnitudes, in systole, to a matched subject with PH that has not yet led to gross shape abnormalities that are obvious to the naked eye. Quantification of the shape (component magnitudes) calculated using the method described in this work is also presented in Fig. 6. Noticeable differences in the shape distribution can be observed, speaking to the sensitivity of this method to early changes in ventricular shape.
Fig. 6.
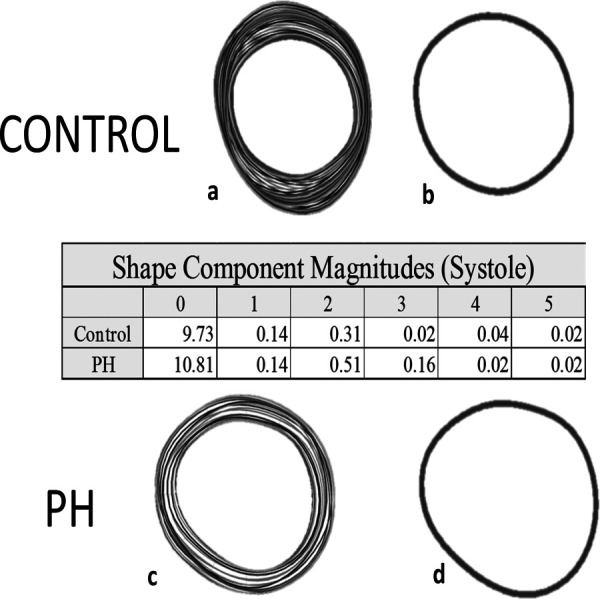
Comparison of shape component magnitudes in systole for a control subject and a PH subject with less obvious deformation illustrating sensitivity of the method to subtle shape changes. Images (a) and (c) are tracings of the endocardial borders across the entire cardiac cycle for a control (a) and PH (c) subjects. Images (b) and (d) are the endocardial border tracings in systole. The table provides quantification of the shape illustrating the sensitivity of the method.
Regression Models.
Logistic regression models were able to distinguish between the PH and control groups with ROC curve accuracy indices area under the curve (AUC) ranging from 0.83 to 0.90. Collinearity was observed for higher order components; however, reduced models did not display significant collinearity with correlation coefficients below 0.14. Variance inflation factors ranged from 1.3 to 5.6. Models derived from systolic frames tend to have the best results, with the exception of the low TR velocity analysis where the reduced diastolic model outperforms the reduced systolic model (AUC of 0.89 versus 0.83). Since the low TR velocity group only consisted of 17 subject pairs, the model is only at a proof-of-concept stage. A series of ROC curves demonstrating optimized versus full models, for both analyses, is provided in Fig. 7.
Fig. 7.
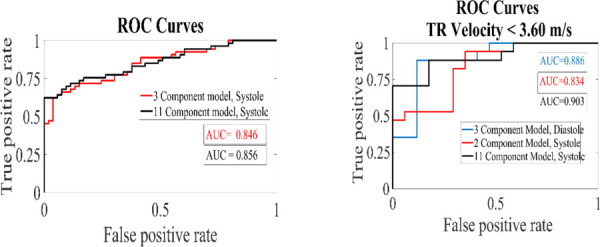
Receiver operating characteristic curves for regression models looking at the full subject cohort and a subanalysis of subjects with TR velocities <3.60 m/s
The model derived from the first 11 shape components for the systolic frames of all 53 subject pairs was optimized down to three components, including shape modes 0, 1, and 10. Simplifying the regression model reduced the area under the curve from 0.86 to 0.85. For the low TR velocity analysis, the systolic model reduced to only two components, 0 and 10 resulting in an AUC 0.834. For lower TR velocities, the most accurate model was again a full systolic model, including shapes 0–10 with an AUC of 0.90. Interestingly, the diastolic model consisting of shapes 0, 4, and 9 also did a good job of predicting PH in the low TR velocity analysis with an AUC of 0.89. It should be noted that the correlation coefficient between shapes 4 and 9 is 0.49. Additionally, the low TR velocity analysis is limited by the number of subject pairs so the results will need to be confirmed in a larger cohort.
TR Velocity Correlation.
Examination of the relationship between TR velocity and shape component magnitude produced three correlations with R2 values > 0.40. Component two (dipole/ellipse) was the component most associated with velocity (R2 = 0.49) while components four and ten also displayed some correlation with R2 values of 0.41 and 0.44, respectively. Figure 8 shows variation in component magnitude with TR velocity for 29 of the 53 subjects with PH. TR velocity data was not available for the other 24 subjects.
Fig. 8.
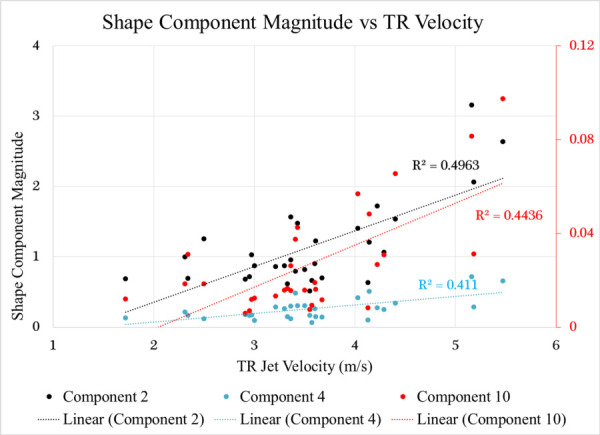
Plot showing a correlation between shape component magnitude and TR velocity for shape components 2, 4, and 10
Discussion
A method for using routinely acquired ultrasound images to screen for PH in the pediatric population has been presented. Decomposition of LV shape into a series of components can facilitate quantitative description of ventricular changes. Component shapes correspond to abnormalities observed in RV pressure overload such as flattening of the septum and eccentricity. Considering that metrics such as eccentricity have been shown to correlate with RV pressure measurements and a correlation between shape components and TR velocity has been identified, it is possible that this tool may allow for noninvasive estimation of cardiovascular pressures [19]. Additionally, differences observed between early (TR velocity < 3.6 m/s) and late stage disease demonstrates the feasibility of using this method of shape quantification to describe the natural progression of LV deformation as a result of intraventricular coupling. This method is appealing due to the relative ease, simplicity, and reproducibility of obtaining parasternal short-axis views of the left ventricle. Additionally, the algorithm does not require large amounts of time or sophisticated computers making the method accessible. The sensitivity with which shapes may be described may also prove to offer other insights into the natural history and progression of PH and potentially allow for earlier quantification of deviations in LV shape.
Future Work
Analysis of a larger cohort with simultaneous RV pressure is under way assessing the correlation between shape distribution and RV pressure measurements obtained via catheter. Additional classifiers such as World Health Organization functional score, disease severity, and etiology should be examined to test this method's ability to classify within the PH population. Investigation of higher order shape modes may also offer insight into systemic cardiovascular mechanics. Shapes three and four (triangular and square) could provide a means to quantify interactions between the intraventricular septum and LV free wall. Preliminary analyses of shape dynamics across the cardiac cycle are also underway. It is hypothesized that incorporation of time data will yield a more sensitive classifier and predictor.
Shape component analysis is a promising method to differentiate PH and control subjects. In addition to being useful as a screening tool for PH, this method shows potential for use as a noninvasive means to estimate intracardiac and vascular pressure. The ability to describe LV shapes with a high level of sensitivity and precision makes this technique a good candidate for tracking disease progression and, perhaps, therapy/treatment efficacy. Further study is warranted.
Acknowledgment
The authors would like to acknowledge the University of Colorado, Department of Bioengineering, and the Children's Hospital Colorado Heart Institute for their support.
Contributor Information
Jennifer L. Wagner, Department of Bioengineering, , University of Colorado, , 12705 E. Montview Boulevard, Suite 100, , Aurora, CO 80045 , e-mail: Jennifer.wagner@ucdenver.edu.
Bruce F. Landeck, II, School of Medicine, , University of Colorado, , Aurora, CO 80045.
Kendall Hunter, Department of Bioengineering, , University of Colorado, , Aurora, CO 80045.
Funding Data
-
•
National Institutes of Health (Grant No. R01HL114753).
References
- [1]. Weyman, A. E. , Wann, S. , Feigenbaum, H. , and Dillon, J. C. , 1976, “ Mechanism of Abnormal Septal Motion in Patients With Right Ventricular Volume Overload a Cross-Sectional Echocardiographic Study,” Circulation, 54(2), pp. 179–187. 10.1161/01.CIR.54.2.179 [DOI] [PubMed] [Google Scholar]
- [2]. Louie, E. K. , Rich, S. , and Brundage, B. H. , “ Doppler Echocardiographic Assessment of Impaired Left Ventricular Filling in Patients With Right Ventricular Pressure Overload Due to Primary Pulmonary Hypertension,” J. Am. Coll. Cardiol., 8(6), pp. 1298–1306. 10.1016/S0735-1097(86)80300-X [DOI] [PubMed] [Google Scholar]
- [3]. Popp, R. L. , Wolfe, S. B. , Hirata, T. , and Feigenbaum, H. , 1969, “ Estimation of Right and Left Ventricular Size by Ultrasound. A Study of the Echoes From the Interventricular Septum,” Am. J. Cardiol., 24(4), pp. 523–530. 10.1016/0002-9149(69)90495-0 [DOI] [PubMed] [Google Scholar]
- [4]. King, M. E. , Braun, H. , Goldblat, A. , Liberthson, R. , and Weyman, A. E. , 1983, “ Interventricular Septal Configuration as a Predictor Right Ventricular Systolic Hypertension Children: A Cross-Sectional Echocardiographic Study,” Circulation, 68(1), pp. 68–75. 10.1161/01.CIR.68.1.68 [DOI] [PubMed] [Google Scholar]
- [5]. López-candales, A. , Rajagopalan, N. , Kochar, M. , Gulyasy, B. , and Edelman, K. , 2008, “ Systolic Eccentricity Index Identifies Right Ventricular Dysfunction Pulmonary Hypertension,” Int. J. Cardiol., 129(3), pp. 424–426. 10.1016/j.ijcard.2007.06.057 [DOI] [PubMed] [Google Scholar]
- [6]. Arsenault, M. , Avelar, E. , Smith, S. , Brittain, P. , Fairhurst, M. , and Vannan, M. , 1999, “ Two-Dimensional Echocardiographic Quantitation Left Ventricular Global Regional Shape: Validation an Algorithm Based Fourier Transformation Curvature Measure Endocardial Contours,” Echocardiography, 16(6), pp. 523–530. 10.1111/j.1540-8175.1999.tb00100.x [DOI] [PubMed] [Google Scholar]
- [7]. Ardekani, S. , Weiss, R. G. , Lardo, A. C. , George, R. T. , Lima, J. A. C. , Wu, K. C. , Miller, M. I. , Winslow, R. L. , and Younes, L. , 2009, “ Computational Method Identifying Quantifying Shape Features Human Left Ventricular Remodeling,” Ann. Biomed. Eng., 37(6), pp. 1043–1054. 10.1007/s10439-009-9677-2 [DOI] [PMC free article] [PubMed] [Google Scholar]
- [8]. Medrano-Gracia, P. , Cowan, B. R. , Ambale-Venkatesh, B. , Bluemke, D. A. , Eng, J. , Finn, J. P. , Fonseca, C. G. , Lima, J. A. C. , Suinesiaputra, A. , and Young, A. , 2014, “ Left Ventricular Shape Variation in Asymptomatic Populations: The Multi-Ethnic Study of Atherosclerosis,” J. Cardiovasc. Magn. Reson., 16, p. 56. 10.1186/s12968-014-0056-2 [DOI] [PMC free article] [PubMed] [Google Scholar]
- [9]. Zhong, L. , Su, Y. , Yeo, S.-Y. , Tan, R.-S. , Ghista, D. N. , and Kassab, G. , 2009, “ Left Ventricular Regional Wall Curvedness and Wall Stress in Patients With Ischemic Dilated Cardiomyopathy,” Am. J. Physiol.-Heart Circ. Physiol., 296(3), pp. H573–H584. 10.1152/ajpheart.00525.2008 [DOI] [PMC free article] [PubMed] [Google Scholar]
- [10]. Hardegree, E. L. , Sachdev, A. , Fenstad, E. R. , Villarraga, H. R. , Frants, R. P. , McGoon, M. D. , Oh, J. K. , Ammash, N. M. , Connolly, H. M. , Eidem, B. W. , Pellikka, P. A. , and Kane, G. C. , 2013, “ Impaired Left Ventricular Mechanics in Pulmonary Arterial Hypertension,” Circ.: Heart Failure, 6(4), pp. 748–756. 10.1161/CIRCHEARTFAILURE.112.000098 [DOI] [PubMed] [Google Scholar]
- [11]. Movahed, M. R. , Hepner, A. , Lizotte, P. , and Milne, N. , 2005, “ Flattening of the Interventricular septum (D-Shaped Left Ventricle) in Addition to High Right Ventricular Tracer Uptake and Increased Right Ventricular Volume Found on Gated SPECT Studies Strongly Correlates With Right Ventricular Overload,” J Nucl. Cardiol., 12(4), pp. 428–434. 10.1016/j.nuclcard.2005.04.004 [DOI] [PubMed] [Google Scholar]
- [12]. Jone, P. , and Ivy, D. D. , 2014, “Echocardiography Pediatric Pulmonary Hypertension,” Front. Pediatr., 124(2), pp. 1–15. 10.3389/fped.2014.00124 [DOI] [PMC free article] [PubMed] [Google Scholar]
- [13]. Jone, P.-N. , Hinzman, J. , Wagner, B. D. , Ivy, D. D. , and Younoszai, A. , 2014, “ Right Ventricular to Left Ventricular Diameter Ratio at End-Systole in Evaluating Outcomes in Children With Pulmonary Hypertension,” J. Am. Soc. Echocardiogr., 27(2), pp. 172–178. 10.1016/j.echo.2013.10.014 [DOI] [PMC free article] [PubMed] [Google Scholar]
- [14]. Tanaka, H. , Tei, C. , Nakao, S. , Tahara, M. , Sakurai, S. , Kashima, T. , and Kanehisa, T. , 1980, “ Diastolic Bulging of the Interventricular Septum Toward the Left Ventricle. An Echocardiographic Manifestation of Negative Interventricular Pressure Gradient Between Left and Right Ventricles During Diastole,” Circulation, 62(3), pp. 558–563. 10.1161/01.CIR.62.3.558 [DOI] [PubMed] [Google Scholar]
- [15]. Burkett, D. A. , Slorach, C. , Patel, S. S. , Redington, A. N. , Ivy, D. D. , Mertens, L. , Younoszai, A. K. , and Friedberg, M. K. , 2016, “ Impact Pulm. Hemodynamics Ventricular Interdependence Left Ventricular Diastolic Function Children With Pulmonary Hypertension,” Circ Cardiovasc Imaging, 9(9), p. e004612. 10.1161/CIRCIMAGING.116.004612 [DOI] [PMC free article] [PubMed] [Google Scholar]
- [16]. Ehrlich, R. , and Weinberg, B. , 1970, “ An Exact Method for Characterization of Grain Shape,” J. Sediment. Res., 40(1), pp. 205–212. [Google Scholar]
- [17]. Marino, P. , and Weiss, L. , 1988, “ Influence of Site of Regional Ischemia on LV Cavity Shape Change in Dogs,” Am. Physiol. Soc., 254, pp. H547–H557. [DOI] [PubMed] [Google Scholar]
- [18]. Azancot, A. , Caudell, T. , Allen, H. D. , Toscani, G. , Debrux, J. L. , Lamberti, A. , Sahn, D. J. , and Goldberg, S. J. , 1985, “ Echocardiographic Ventricular Shape Analysis in Congenital Heart Disease With Right Ventricular Volume or Pressure Overload,” Am. J. Cardiol., 56(8), pp. 520–526.https://www.ncbi.nlm.nih.gov/pubmed/4036838 [DOI] [PubMed] [Google Scholar]
- [19]. Kass, D. A. , Traill, T. A. , Keating, M. , Altieri, P. I. , and Maughan, W. L. , 1988, “ Abnormalities of Dynamic Ventricular Shape Changes in Patients With Aortic and Mitral Valvular Regurgitation: Assessment by Fourier Shape Analysis and Global Geometric Indexes,” Circ. Res., 62(1), pp. 127–138. 10.1161/01.RES.62.1.127 [DOI] [PubMed] [Google Scholar]
- [20]. Lang, R. M. , Badano, L. P. , Mor-Avi, V. , Afilalo, J. , Armstrong, A. , Ernande, L. , Flachskampf, F. A. , Foster, E. , Goldstein, S. A. , Kuznetsove, T. , Lancellotti, P. , Muraru, D. , Picard, M. H. , Rietzschil, E. R. , Rudski, L. , Spencer, K. T. , Tsang, W. , and Voight, J. , 2015, “ Recommendations for Cardiac Chamber Quantification by Echocardiography in Adults: An Update From the American Society of Echocardiography and the European Association of Cardiovascular Imaging,” J. Am. Soc. Echocardiogr., 28(1), pp. 1–39. 10.1016/j.echo.2014.10.003 [DOI] [PubMed] [Google Scholar]


